Is GMU really diverse? College Factual’s diversity report shows the data about diversity at GMU. We reviewed racial demographics, gender ratios, student age ranges, and where students come from.
What does diversity really mean at the college level? College Factual ran the numbers to discover how diverse the typical college campus really is, including race, gender, the ages of the students, and where they’re from.
GMU total enrollment is approximately 30,253 students. 23,814 are undergraduates and 6,439 are graduate students.
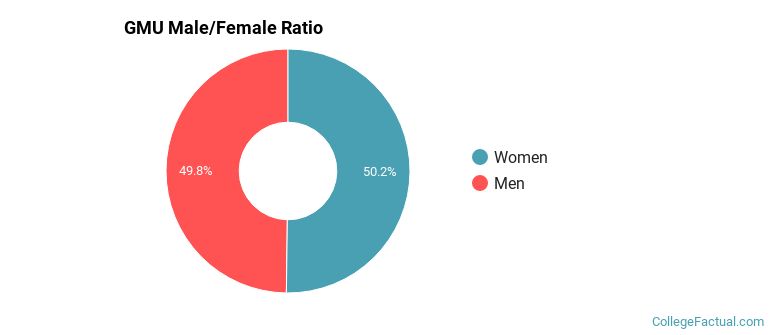
Male/Female Breakdown of Undergraduates
The full-time GMU undergraduate population is made up of 49.4% women, and 50.6% men.
For the gender breakdown for all students, go here.
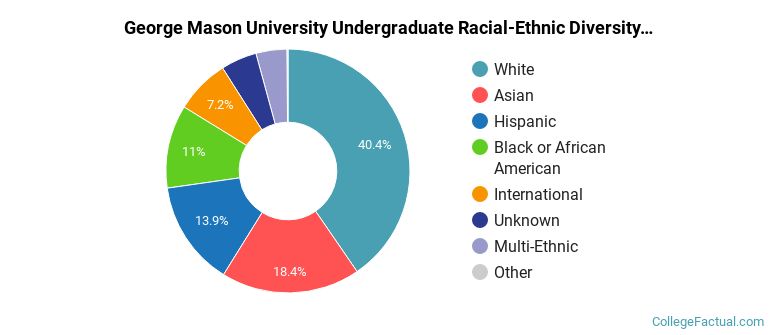
GMU Racial/Ethnic Breakdown of Undergraduates
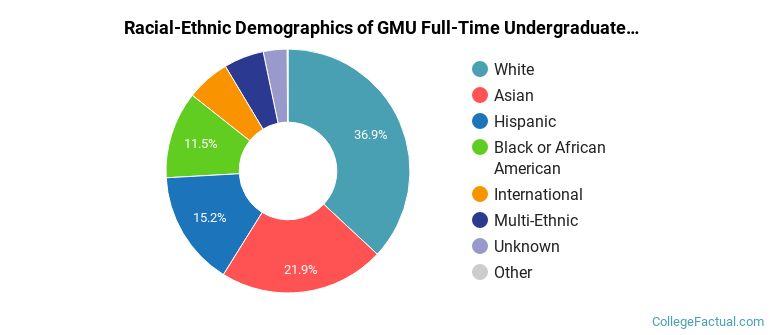
| Race/Ethnicity | Number | Percent |
|---|---|---|
| White | 7,861 | 33.1% |
| Asian | 5,507 | 23.2% |
| Hispanic | 3,953 | 16.6% |
| Black or African American | 2,915 | 12.3% |
| International | 1,446 | 6.1% |
| Multi-Ethnic | 1,331 | 5.6% |
| Unknown | 752 | 3.2% |
| Native Hawaiian or Pacific Islander | 19 | 0.1% |
See racial/ethnic breakdown for all students.
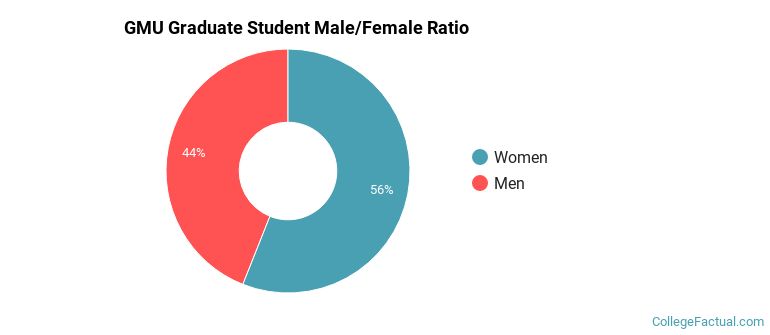
Male/Female Breakdown of Graduate Students
About 51.8% of full-time grad students are women, and 48.2% men.
For the gender breakdown for all students, go here.
GMU Racial-Ethnic Breakdown of Graduate Students
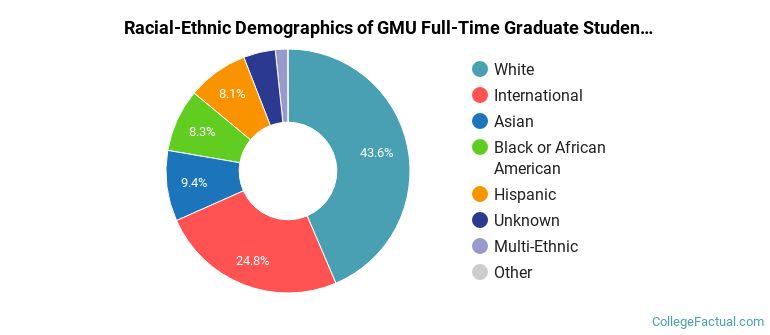
| Race/Ethnicity | Number | Percent |
|---|---|---|
| International | 2,899 | 45.1% |
| White | 1,942 | 30.2% |
| Asian | 463 | 7.2% |
| Black or African American | 432 | 6.7% |
| Hispanic | 429 | 6.7% |
| Unknown | 191 | 3.0% |
| Multi-Ethnic | 70 | 1.1% |
See racial/ethnic breakdown for all students.
| Race/Ethnicity | Number | Percent |
|---|---|---|
| White | 9,803 | 32.4% |
| Asian | 5,970 | 19.8% |
| Hispanic | 4,382 | 14.5% |
| International | 4,345 | 14.4% |
| Black or African American | 3,347 | 11.1% |
| Multi-Ethnic | 1,401 | 4.6% |
| Unknown | 943 | 3.1% |
| Native Hawaiian or Pacific Islander | 19 | 0.1% |
George Mason University faculty racial/ethnic demographics (share of instructional staff):
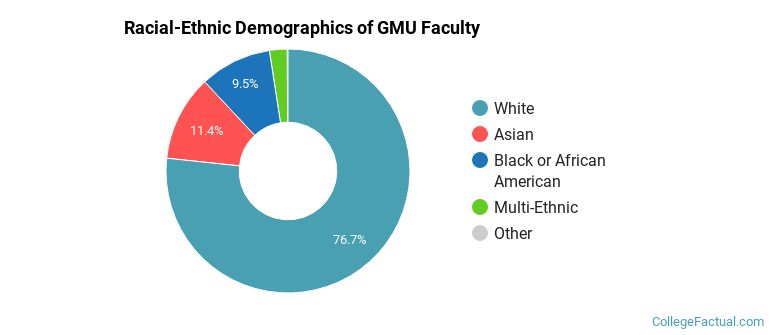
| Ethnicity | Percent of Faculty |
|---|---|
| White | 61.5% |
| Asian | 16.0% |
| International | 8.3% |
| Black or African American | 5.4% |
| Hispanic | 3.7% |
| Unknown | 2.9% |
| Multi-Ethnic | 2.1% |
This school is more popular with men than with women.

There are approximately 15,108 female students and 15,145 male students at GMU.
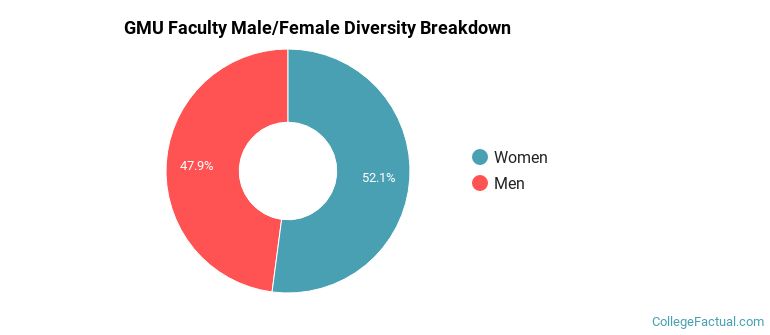
George Mason University faculty gender breakdown (share of instructional staff):
Among first-time degree-seeking undergraduates, 0.8% of GMU students come from within the state, and 99.2% come from out of state.
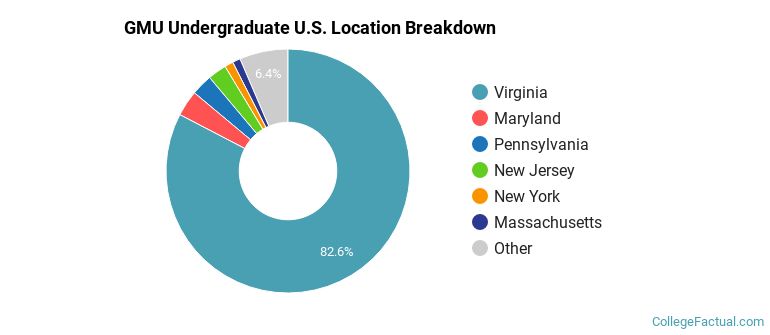
The undergraduate student body is split among 45 states (may include Washington D.C.). Click on the map for more detail.
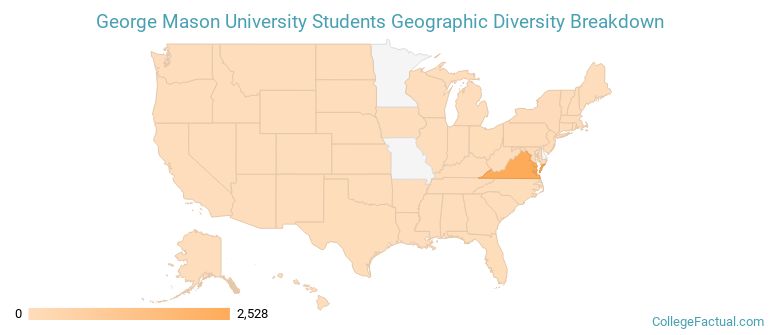
| State | Amount | Percent |
|---|---|---|
| Virginia | 3,454 | 84.7% |
| Maryland | 160 | 3.9% |
| District of Columbia | 81 | 2.0% |
| Pennsylvania | 59 | 1.4% |
| Texas | 41 | 1.0% |
GMU enrolls approximately 14.4% international (nonresident) students, adding to the international character of the campus.
A traditional college student is defined as being between the ages of 18-21. At GMU, 44.4% of undergraduate students fall into that category, compared to the national average of 60%.
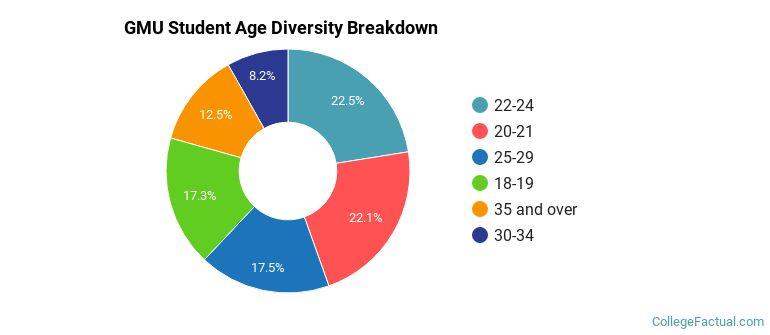
Student Age Group Amount Percent 20-21 9,527 24.0% 22-24 9,082 22.8% 18-19 8,113 20.4% 25-29 5,859 14.7% 35 and over 4,226 10.6% 30-34 2,489 6.3% Under 18 466 1.2%
Footnotes
*The racial-ethnic minorities count is calculated by taking the total number of students and subtracting white students, international students, and students whose race/ethnicity was unknown. This number is then divided by the total number of students at the school to obtain the racial-ethnic minorities percentage.
References