The main focus area for this major is General Mechanical Engineering. For more details on this concentration, visit its profile page.
Mechanical Engineering is a major offered under the engineering program of study at Massachusetts Institute of Technology. We’ve gathered data and other essential information about the bachelor’s degree program in ME, such as diversity of students, how many students graduated in recent times, and more.
You can jump to any section of this page using the links below:
In order to help students and their parents find the best school for them, we have created several different types of college rankings, which are updated yearly. Ranked at #3 in College Factual's most recent rankings, MIT is in the top 1% of the country for ME students pursuing a bachelor's degree. It is also ranked #2 in Massachusetts.
Here are some of the other rankings for MIT.
In 2019-2020, the average part-time undergraduate tuition at MIT was $860 per credit hour for both in-state and out-of-state students. The average full-time tuition and fees for undergraduates are shown in the table below.
| In State | Out of State | |
|---|---|---|
| Tuition | $53,450 | $53,450 |
| Books and Supplies | $830 | $830 |
| On Campus Room and Board | $16,000 | $16,000 |
| On Campus Other Expenses | $2,182 | $2,182 |
Learn more about MIT tuition and fees.
One factor in determining the overall cost in a degree is to consider how much in student loans you’ll have to take out. Students who received their bachelor’s degree at MIT in ME walked away with an average of $13,000 in student debt. That is 43% lower than the national average of $22,913.

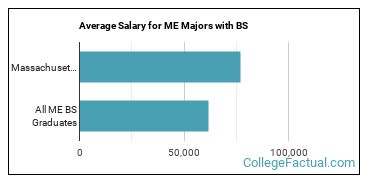
The median early career salary of ME students who receive their bachelor’s degree from MIT is $76,802 per year. That is 24% higher than the national average of $61,915.
Online degrees for the MIT ME bachelor’s degree program are not available at this time. To see if the school offers distance learning options in other areas, visit the MIT Online Learning page.
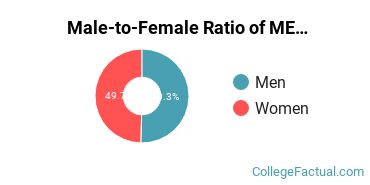
Women made up around 49.7% of the ME students who took home a bachelor’s degree in 2019-2020. This is higher than the nationwide number of 16.3%.
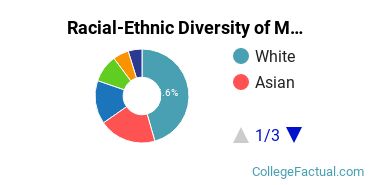
Racial-ethnic minority graduates* made up 48.3% of the ME bachelor’s degrees at MIT in 2019-2020. This is higher than the nationwide number of 28%.
| Race/Ethnicity | Number of Students |
|---|---|
| Asian | 29 |
| Black or African American | 7 |
| Hispanic or Latino | 22 |
| Native American or Alaska Native | 0 |
| Native Hawaiian or Pacific Islander | 0 |
| White | 67 |
| International Students | 8 |
| Other Races/Ethnicities | 14 |
Mechanical Engineering students may decide to major in one of the following focus areas.
| Focus Area | Annual Graduates |
|---|---|
| General Mechanical Engineering | 147 |
You may also be interested in one of these majors related to mechanical engineering.
| Related Major | Annual Graduates |
|---|---|
| Aerospace & Aeronautical Engineering | 53 |
| Biomedical Engineering | 50 |
| Chemical Engineering | 42 |
| Civil Engineering | 6 |
| Electrical Engineering | 44 |
*The racial-ethnic minorities count is calculated by taking the total number of students and subtracting white students, international students, and students whose race/ethnicity was unknown. This number is then divided by the total number of students at the school to obtain the racial-ethnic minorities percentage.
More about our data sources and methodologies.