The main focus area for this major is General Mechanical Engineering. For more details on this concentration, visit its profile page.
Mechanical Engineering is a major offered under the engineering program of study at Southern Methodist University. Here, you’ll find out more about the major bachelor’s degree program in ME, including such details as the number of graduates, ethnicity of students, related majors and concentrations, and more.
If there’s something special you’re looking for, you can use one of the links below to find it:
If you're having trouble deciding which school is best for you, you may want to check out our many college rankings. The bachelor's program at SMU was ranked #85 on College Factual's Best Schools for ME list. It is also ranked #5 in Texas.
Here are some of the other rankings for SMU.
Part-time undergraduates at SMU paid an average of $2,171 per credit hour in 2019-2020. This tuition was the same for both in-state and out-of-state students. The average full-time tuition and fees for undergraduates are shown in the table below.
| In State | Out of State | |
|---|---|---|
| Tuition | $51,958 | $51,958 |
| Fees | $6,582 | $6,582 |
| Books and Supplies | $800 | $800 |
| On Campus Room and Board | $17,110 | $17,110 |
| On Campus Other Expenses | $2,600 | $2,600 |
Learn more about SMU tuition and fees.
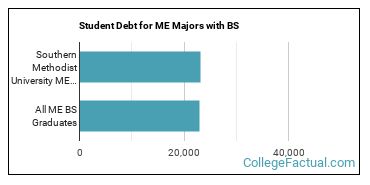
One way to think about how much a school will cost is to look at how much in student loans that you have to take out to get your degree. Students who received their bachelor’s degree at SMU in ME walked away with an average of $23,250 in student debt. That is about the same as the national average of $22,913.
ME who receive their bachelor’s degree from SMU make an average of $68,858 a year during the early days of their career. That is 11% higher than the national average of $61,915.

Online degrees for the SMU ME bachelor’s degree program are not available at this time. To see if the school offers distance learning options in other areas, visit the SMU Online Learning page.
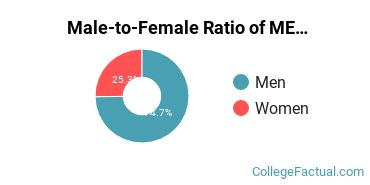
Women made up around 25.3% of the ME students who took home a bachelor’s degree in 2019-2020. This is higher than the nationwide number of 16.3%.
Of those graduates who received a bachelor’s degree in ME at SMU in 2019-2020, 27.8% were racial-ethnic minorities*. This is about the same as the nationwide number of 28%.
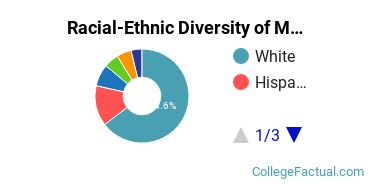
| Race/Ethnicity | Number of Students |
|---|---|
| Asian | 3 |
| Black or African American | 4 |
| Hispanic or Latino | 11 |
| Native American or Alaska Native | 0 |
| Native Hawaiian or Pacific Islander | 0 |
| White | 51 |
| International Students | 6 |
| Other Races/Ethnicities | 4 |
Mechanical Engineering students may decide to major in one of the following focus areas.
| Focus Area | Annual Graduates |
|---|---|
| General Mechanical Engineering | 79 |
You may also be interested in one of these majors related to mechanical engineering.
| Related Major | Annual Graduates |
|---|---|
| Civil Engineering | 20 |
| Computer Engineering | 4 |
| Electrical Engineering | 22 |
| Environmental Engineering | 11 |
| Operations Research | 37 |
*The racial-ethnic minorities count is calculated by taking the total number of students and subtracting white students, international students, and students whose race/ethnicity was unknown. This number is then divided by the total number of students at the school to obtain the racial-ethnic minorities percentage.
More about our data sources and methodologies.