Biological & Biomedical Sciences is a program of study at Valparaiso University. The school offers a bachelor’s degree in the area. We’ve pulled together some essential information you should know about the bachelor’s degree program in biological and biomedical sciences, including how many students graduate each year, the ethnic diversity of these students, whether or not the degree is offered online, and more.
You can jump to any section of this page using the links below:
Each year, we produce a number of different types of college rankings to help students decide which school is the best fit for them. The bachelor's program at Valpo was ranked #337 on College Factual's Best Schools for biological and biomedical sciences list. It is also ranked #6 in Indiana.
Here are some of the other rankings for Valpo.
Part-time undergraduates at Valpo paid an average of $1,840 per credit hour in 2019-2020. This tuition was the same for both in-state and out-of-state students. The average full-time tuition and fees for undergraduates are shown in the table below.
| In State | Out of State | |
|---|---|---|
| Tuition | $41,940 | $41,940 |
| Fees | $1,346 | $1,346 |
| Books and Supplies | $1,200 | $1,200 |
| On Campus Room and Board | $12,620 | $12,620 |
| On Campus Other Expenses | $1,620 | $1,620 |
Learn more about Valpo tuition and fees.
Online degrees for the Valpo biological and biomedical sciences bachelor’s degree program are not available at this time. To see if the school offers distance learning options in other areas, visit the Valpo Online Learning page.
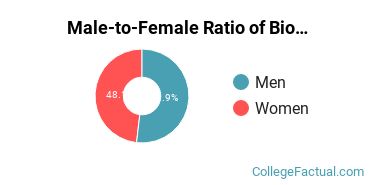
Of the students who received their bachelor’s degree in biological and biomedical sciences in 2019-2020, 55.8% of them were women. This is less than the nationwide number of 64.5%.
Of those graduates who received a bachelor’s degree in biological and biomedical sciences at Valpo in 2019-2020, 20.9% were racial-ethnic minorities*. This is lower than the nationwide number of 42%.
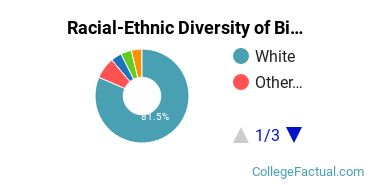
| Race/Ethnicity | Number of Students |
|---|---|
| Asian | 4 |
| Black or African American | 1 |
| Hispanic or Latino | 2 |
| Native American or Alaska Native | 1 |
| Native Hawaiian or Pacific Islander | 0 |
| White | 32 |
| International Students | 0 |
| Other Races/Ethnicities | 3 |
Biological & Biomedical Sciences students may decide to major in one of the following focus areas.
| Focus Area | Annual Graduates |
|---|---|
| General Biology | 39 |
| Biochemistry, Biophysics & Molecular Biology | 4 |
*The racial-ethnic minorities count is calculated by taking the total number of students and subtracting white students, international students, and students whose race/ethnicity was unknown. This number is then divided by the total number of students at the school to obtain the racial-ethnic minorities percentage.
More about our data sources and methodologies.