Go directly to any of the following sections:
The experimental psychology major at Yale is not ranked on College Factual’s Best Colleges and Universities for Experimental Psychology. This could be for a number of reasons, such as not having enough data on the major or school to make an accurate assessment of its quality.
During the 2020-2021 academic year, Yale University handed out 53 bachelor's degrees in experimental psychology. This is a decrease of 24% over the previous year when 70 degrees were handed out.
In 2021, 34 students received their master’s degree in experimental psychology from Yale. This makes it the #1 most popular school for experimental psychology master’s degree candidates in the country.
In addition, 16 students received their doctoral degrees in experimental psychology in 2021, making the school the #3 most popular school in the United States for this category of students.
Take a look at the following statistics related to the make-up of the experimental psychology majors at Yale University.
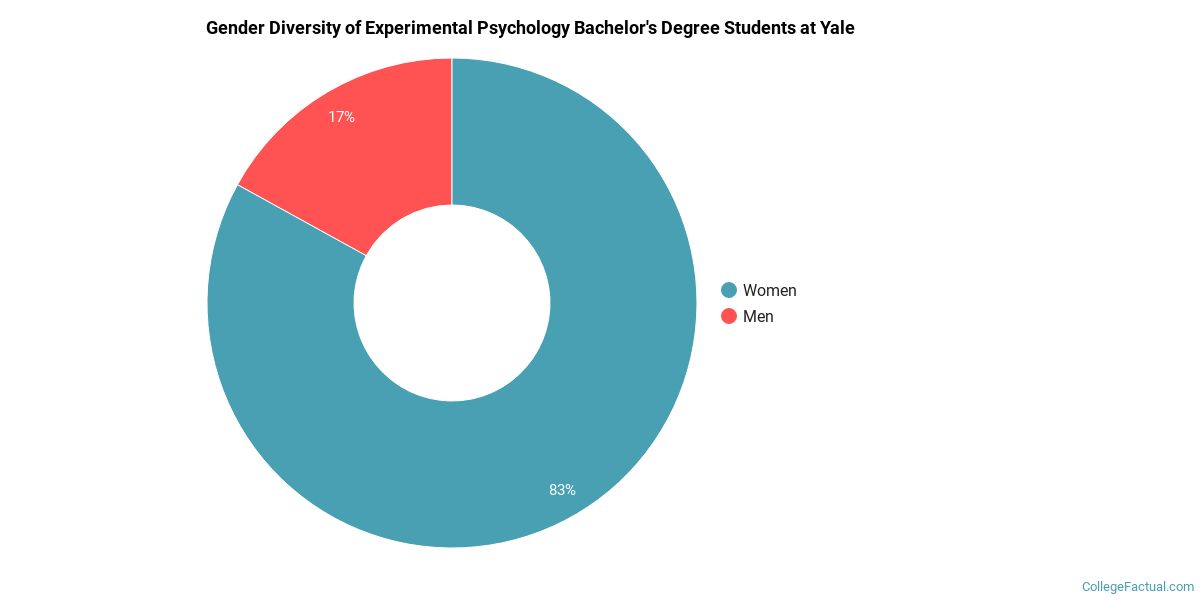
For the most recent academic year available, 17% of experimental psychology bachelor's degrees went to men and 83% went to women.
The following table and chart show the ethnic background for students who recently graduated from Yale University with a bachelor's in experimental psychology.

| Ethnic Background | Number of Students |
|---|---|
| Asian | 9 |
| Black or African American | 3 |
| Hispanic or Latino | 7 |
| White | 22 |
| Non-Resident Aliens | 5 |
| Other Races | 7 |
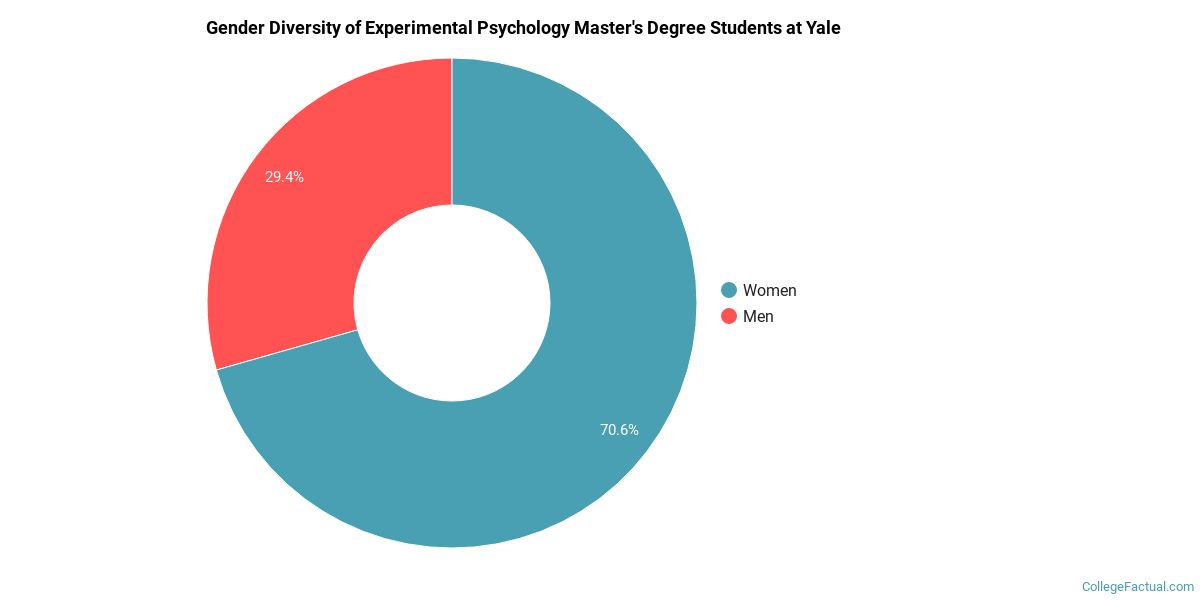
The experimental psychology program at Yale awarded 34 master's degrees in 2020-2021. About 29% of these degrees went to men with the other 71% going to women.
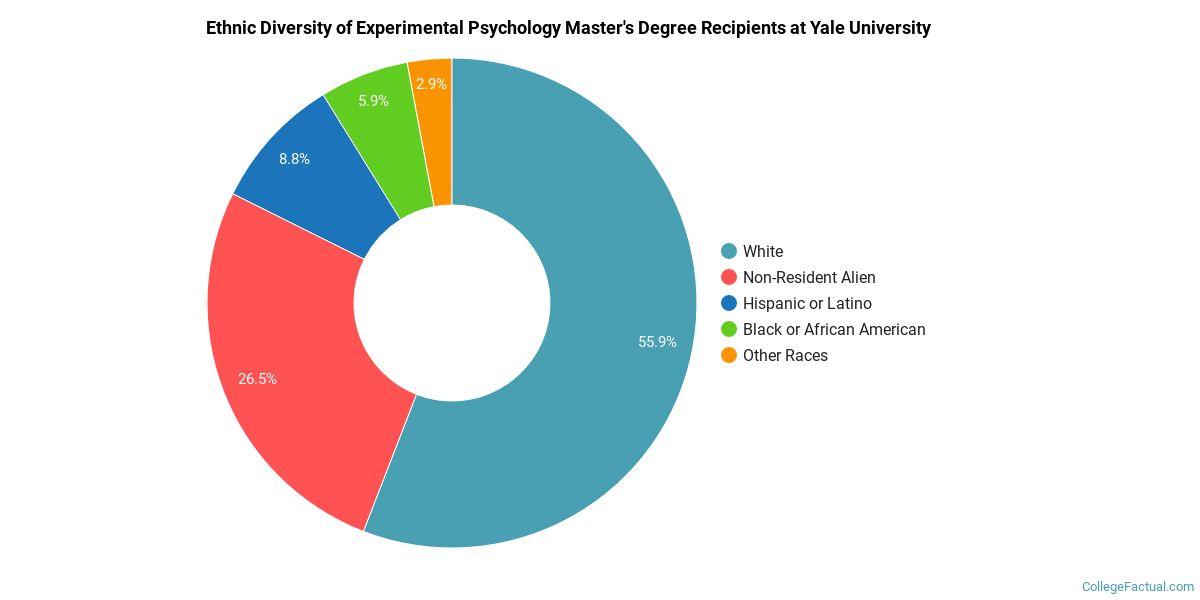
The majority of master's degree recipients in this major at Yale are white. In the most recent graduating class for which data is available, 56% of students fell into this category.
The following table and chart show the ethnic background for students who recently graduated from Yale University with a master's in experimental psychology.
| Ethnic Background | Number of Students |
|---|---|
| Asian | 0 |
| Black or African American | 2 |
| Hispanic or Latino | 3 |
| White | 19 |
| Non-Resident Aliens | 9 |
| Other Races | 1 |
More about our data sources and methodologies.