College Factual recognizes the best colleges and universities in its annual rankings. These rankings include categories for best overall colleges, best colleges for each major, best value schools, and much more.
American River College was awarded 5 badges in the 2025 rankings. The highest ranked major at the school is business administration & management.
Explore the best ranked schools for the programs you are most interested in.
College Factual ranked American River as #1,049 out of 2,152 colleges and universities in the country on its 2025 Best Colleges list. This is an improvement over the previous year, when American River held the #1,324 spot on the Best Overall Colleges list.
Out of the 161 colleges in California, American River is ranked at #116.
Returning adults and other non-traditional students may appreciate the fact that American River College has an open admissions policy. This means that you'll only have to submit basic materials, which may include proof that you completed high school or an equivalent program.
At American River College, the student to faculty ratio is 27 to 1. Compared to the national average of 15 to 1, this is somewhat high. This could mean that class sizes may be larger than they are at other colleges or universities or that professors may be required to teach more classes.
In addition to the student to faculty ratio, some people look at what percentage of faculty members are full-time as a sign of how much time professors will be able to spend with their students. This is because part-time teachers may not be be on campus as much as their full-time counterparts.
The full-time faculty percentage at American River College is 42%. This is lower than the national average of 47%.
The freshmen retention rate tells us what percentage of first-year, full-time students choose to continue on to their sophomore year at a particular school. The rate at American River College is 69%, which is about average when compared to the national rate of 68%.
During the 2017-2018 academic year, there were 25,422 undergraduates at American River with 4,989 being full-time and 20,433 being part-time.
The net price is calculated by adding tuition, room, board and other costs and subtracting financial aid.Note that the net price is typically less than the published for a school. For more information on the sticker price of American River, see our tuition and fees and room and board pages.
Almost 66% of college students who graduated with the class of 2018 took out student loans, but that percentage varies from school to school. At American River, approximately 2% of students took out student loans averaging $6,454 a year. That adds up to $25,816 over four years for those students.
The student loan default rate at American River is 1.0%. This is significantly lower than the national default rate of 10.1%, which is a good sign that you'll be able to pay back your student loans.
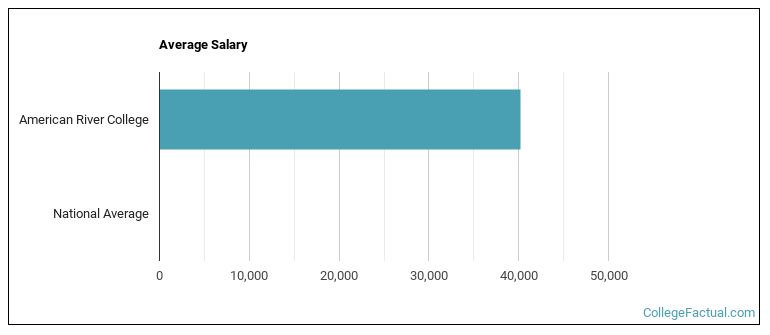
See which majors at American River College make the most money.
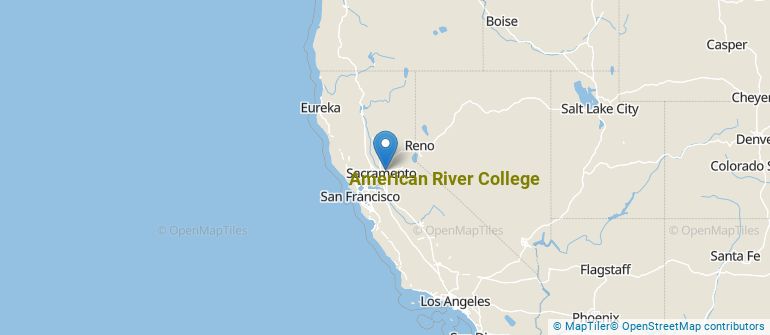
Get more details about the location of American River College.
Contact details for American River are given below.
| Contact Details | |
|---|---|
| Address: | 4700 College Oak Dr, Sacramento, CA 95841-4286 |
| Phone: | 916-484-8011 |
| Website: | https://www.arc.losrios.edu/ |
| Most Popular Majors | Bachelor’s Degrees | Average Salary of Graduates |
|---|---|---|
| Liberal Arts General Studies | 800 | NA |
| General Social Sciences | 411 | NA |
| Biological & Physical Science | 367 | NA |
| Business Administration & Management | 254 | NA |
| Human Development & Family Studies | 163 | NA |
| General Psychology | 159 | NA |
| General Physical Sciences | 109 | NA |
| Legal Support Services | 88 | NA |
| Accounting | 78 | NA |
| Criminal Justice & Corrections | 76 | NA |
Online learning options are becoming more and more popular at American colleges and universities. Online classes are great for students who have busy schedules or for those who just want to study on their own time.
In 2022-2023, 18,893 students took at least one online class at American River College. This is a decrease from the 21,131 students who took online classes the previous year.
| Year | Took at Least One Online Class | Took All Classes Online |
|---|---|---|
| 2022-2023 | 18,893 | 14,286 |
| 2021-2022 | 21,131 | 19,106 |
| 2020-2021 | 15,778 | 7,172 |
| 2018-2019 | 9,398 | 4,316 |
Footnotes
*The racial-ethnic minorities count is calculated by taking the total number of students and subtracting white students, international students, and students whose race/ethnicity was unknown. This number is then divided by the total number of students at the school to obtain the racial-ethnic minorities percentage.
References
More about our data sources and methodologies.