College Factual recognizes the best colleges and universities in its annual rankings. These rankings include categories for best overall colleges, best colleges for each major, best value schools, and much more.
Augustana College was awarded 6 badges in the 2025 rankings. The highest ranked major at the school is general biology.
Explore the best ranked schools for the programs you are most interested in.
Augustana is ranked #533 out of 2,152 schools in the nation for overall quality on College Factual's 2025 Best Colleges list.
Out of the 85 colleges in Illinois, Augustana is ranked at #21.
Augustana College has an acceptance rate of 61%, which means the school is serious about who it admits. Take your time in putting together a strong application that highlights why you are a good fit for Augustana.
About 68% of students accepted to Augustana submitted their SAT scores. When looking at the 25th through the 75th percentile, SAT Evidence-Based Reading and Writing scores ranged between 510 and 630. Math scores were between 500 and 620.
The student to faculty ratio is often used to measure the number of teaching resources that a college or university offers its students. The national average for this metric is 15 to 1, but at Augustana it is much better at 11 to 1. That's good news for students who want to interact more on a personal level with their teachers.
In addition to the student to faculty ratio, some people look at what percentage of faculty members are full-time as a sign of how much time professors will be able to spend with their students. This is because part-time teachers may not be be on campus as much as their full-time counterparts.
The full-time faculty percentage at Augustana College is 78%. This is higher than the national average of 47%.
The freshmen retention rate of 81% tells us that most first-year, full-time students like Augustana College enough to come back for another year. This is a fair bit higher than the national average of 68%. That's certainly something to check off in the good column about the school.
The on-time graduation rate for someone pursuing a bachelor's degree is typically four years. This rate at Augustana for first-time, full-time students is 73%, which is better than the national average of 33.3%.
Find out more about the retention and graduation rates at Augustana College.
During the 2017-2018 academic year, there were 2,377 undergraduates at Augustana with 2,358 being full-time and 19 being part-time.
| $0-30 K | $30K-48K | $48-75 | $75-110K | $110K + |
|---|---|---|---|---|
| $10,202 | $8,425 | $14,345 | $19,455 | $8,894 |
The net price is calculated by adding tuition, room, board and other costs and subtracting financial aid.Note that the net price is typically less than the published for a school. For more information on the sticker price of Augustana, see our tuition and fees and room and board pages.
Almost 66% of college students who graduated with the class of 2018 took out student loans, but that percentage varies from school to school. At Augustana, approximately 58% of students took out student loans averaging $8,033 a year. That adds up to $32,132 over four years for those students.
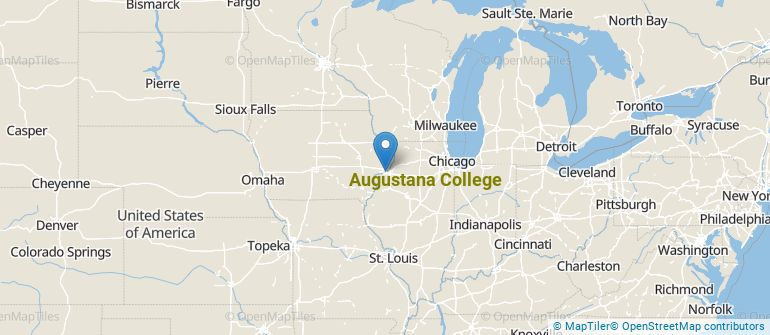
Get more details about the location of Augustana College.
Contact details for Augustana are given below.
| Contact Details | |
|---|---|
| Address: | 639 38Th St, Rock Island, IL 61201-2296 |
| Phone: | 309-794-7000 |
| Website: | www.augustana.edu/ |
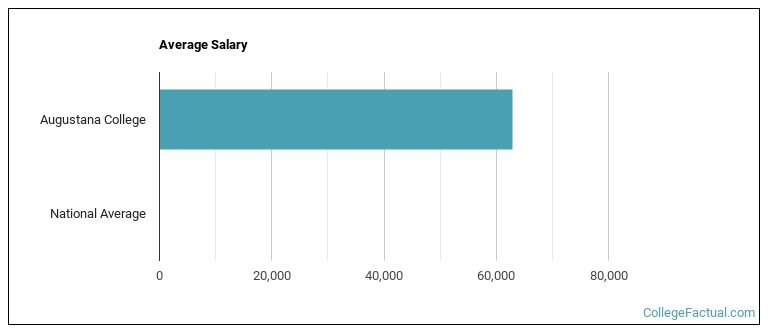
| Most Popular Majors | Bachelor’s Degrees | Average Salary of Graduates |
|---|---|---|
| General Biology | 78 | $32,844 |
| Teacher Education Subject Specific | 59 | $45,145 |
| General Psychology | 52 | $29,801 |
| Business Administration & Management | 51 | $50,210 |
| Marketing | 37 | NA |
| Communication & Media Studies | 34 | $40,806 |
| Communication Sciences | 32 | NA |
| Accounting | 31 | $62,149 |
| Finance & Financial Management | 27 | NA |
| Computer Science | 27 | $74,745 |
Footnotes
*The racial-ethnic minorities count is calculated by taking the total number of students and subtracting white students, international students, and students whose race/ethnicity was unknown. This number is then divided by the total number of students at the school to obtain the racial-ethnic minorities percentage.
References
More about our data sources and methodologies.