Explore the best ranked schools for the programs you are most interested in.
College Factual ranked BSC as #1,504 out of 2,152 colleges and universities in the country on its 2025 Best Colleges list. This is an improvement over the previous year, when BSC held the #1,515 spot on the Best Overall Colleges list.
BSC also holds the #26 spot on the Best Colleges in Alabama ranking.
If you're applying to Birmingham Southern College you'll face some tough competition, since the school's acceptance rate is only 57%. Definitely don't wait until the last minute to submit your application, since applying early may be in your favor.
About 14% of students accepted to BSC submitted their SAT scores. When looking at the 25th through the 75th percentile, SAT Evidence-Based Reading and Writing scores ranged between 590 and 670. Math scores were between 560 and 610.
At BSC, the student to faculty ratio is an excellent 10 to 1. That's much better than the national average of 15 to 1. This indicates that many classes will probably be small, and students will have ample opportunites to work closely with their professors and classmates.
In addition to the student to faculty ratio, some people look at what percentage of faculty members are full-time as a sign of how much time professors will be able to spend with their students. This is because part-time teachers may not be be on campus as much as their full-time counterparts.
The full-time faculty percentage at Birmingham Southern College is 83%. This is higher than the national average of 47%.
The freshmen retention rate of 77% tells us that most first-year, full-time students like Birmingham Southern College enough to come back for another year. This is a fair bit higher than the national average of 68%. That's certainly something to check off in the good column about the school.
The on-time graduation rate for someone pursuing a bachelor's degree is typically four years. This rate at BSC for first-time, full-time students is 65%, which is better than the national average of 33.3%.
Find out more about the retention and graduation rates at Birmingham Southern College.
During the 2017-2018 academic year, there were 1,129 undergraduates at BSC with 1,126 being full-time and 3 being part-time.
| $0-30 K | $30K-48K | $48-75 | $75-110K | $110K + |
|---|---|---|---|---|
| $17,530 | $17,196 | $18,649 | $20,596 | $21,035 |
The net price is calculated by adding tuition, room, board and other costs and subtracting financial aid.Note that the net price is typically less than the published for a school. For more information on the sticker price of BSC, see our tuition and fees and room and board pages.
Almost 66% of college students who graduated with the class of 2018 took out student loans, but that percentage varies from school to school. At BSC, approximately 86% of students took out student loans averaging $7,274 a year. That adds up to $29,096 over four years for those students.
Get more details about paying for Birmingham Southern College.
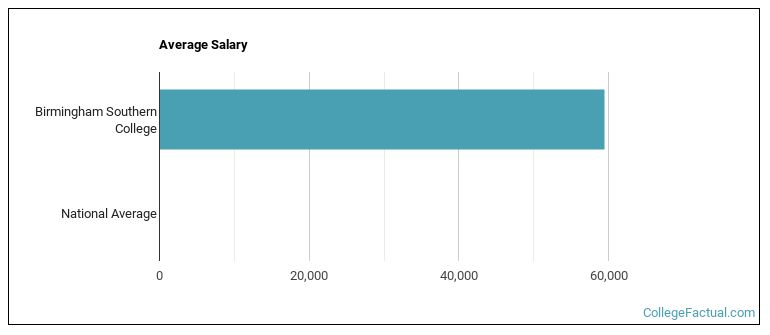
See which majors at Birmingham Southern College make the most money.
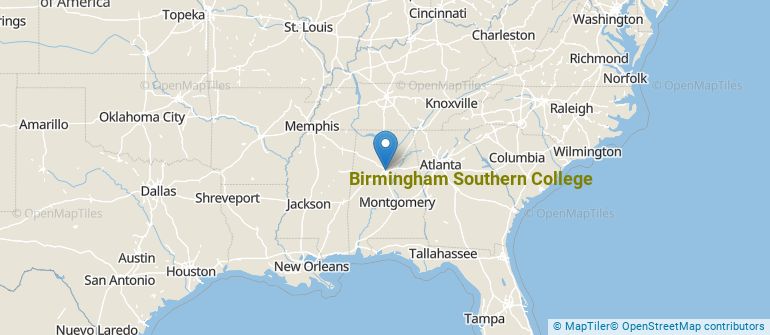
Get more details about the location of Birmingham Southern College.
Contact details for BSC are given below.
| Contact Details | |
|---|---|
| Address: | 900 Arkadelphia Road, Birmingham, AL 35254 |
| Phone: | 205-226-4600 |
| Website: | www.bsc.edu/ |
| Most Popular Majors | Bachelor’s Degrees | Average Salary of Graduates |
|---|---|---|
| Business Administration & Management | 57 | $40,689 |
| General Psychology | 26 | $27,383 |
| General Biology | 25 | NA |
| Health Sciences & Services | 23 | NA |
| Fine & Studio Arts | 17 | NA |
| Communication & Media Studies | 13 | NA |
| History | 12 | NA |
| Computer Information Systems | 11 | NA |
| Sociology | 10 | NA |
| Accounting | 9 | NA |
If you’re considering Birmingham Southern College, here are some more schools you may be interested in knowing more about.
Curious on how these schools stack up against BSC? Pit them head to head with College Combat, our free interactive tool that lets you compare college on the features that matter most to you!
Footnotes
*The racial-ethnic minorities count is calculated by taking the total number of students and subtracting white students, international students, and students whose race/ethnicity was unknown. This number is then divided by the total number of students at the school to obtain the racial-ethnic minorities percentage.
References
More about our data sources and methodologies.