College Factual analyzes over 2,000 colleges and universities in its annual rankings and ranks them in a variety of ways, including most diverse, best overall quality, best for non-traditional students, and much more.
California Institute of the Arts was awarded 1 badge in the 2025 rankings. The highest ranked major at the school is drama & theater arts.
Explore the best ranked schools for the programs you are most interested in.
CalArts was not ranked in College Factual's Best Overall Colleges report this year. This may be because not enough data was available.
See all of the rankings for California Institute of the Arts.
With an acceptance rate of 25%, CalArts is one of the most selective schools in the country. Good grades and high test scores alone may not be enough to get you into the school, so do your best to submit a stellar application.
The student to faculty ratio is often used to measure the number of teaching resources that a college or university offers its students. The national average for this metric is 15 to 1, but at CalArts it is much better at 7 to 1. That's good news for students who want to interact more on a personal level with their teachers.
Another measure that is often used to estimate how much access students will have to their professors is how many faculty members are full-time. The idea here is that part-time faculty tend to spend less time on campus, so they may not be as available to students as full-timers.
The full-time faculty percentage at California Institute of the Arts is 46%. This is comparable to the national average of 47%.
The freshmen retention rate of 85% tells us that most first-year, full-time students like California Institute of the Arts enough to come back for another year. This is a fair bit higher than the national average of 68%. That's certainly something to check off in the good column about the school.
Students are considered to have graduated on time if they finish their studies within four years. At CalArts the on-time graduation rate of first-time, full-time students is 56%. That is great when compared to the national average of 33.3%
Find out more about the retention and graduation rates at California Institute of the Arts.
During the 2017-2018 academic year, there were 762 undergraduates at CalArts with 665 being full-time and 97 being part-time.
| $0-30 K | $30K-48K | $48-75 | $75-110K | $110K + |
|---|---|---|---|---|
| $38,505 | $42,852 | $50,135 | $50,074 | $63,192 |
The net price is calculated by adding tuition, room, board and other costs and subtracting financial aid.Note that the net price is typically less than the published for a school. For more information on the sticker price of CalArts, see our tuition and fees and room and board pages.
It's not uncommon for college students to take out loans to pay for school. In fact, almost 66% of students nationwide depend at least partially on loans. At CalArts, approximately 32% of students took out student loans averaging $9,981 a year. That adds up to $39,924 over four years for those students.
Get more details about paying for California Institute of the Arts.
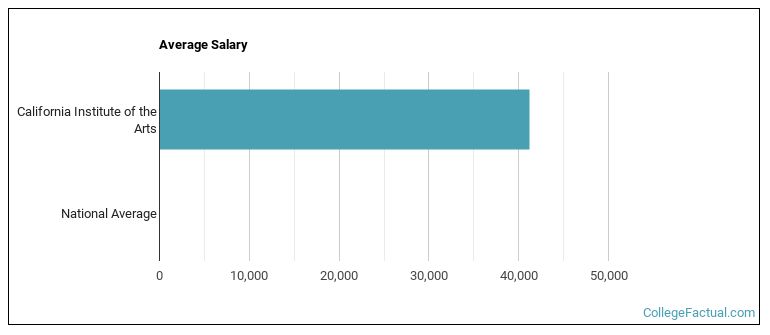
See which majors at California Institute of the Arts make the most money.
Get more details about the location of California Institute of the Arts.

Contact details for CalArts are given below.
| Contact Details | |
|---|---|
| Address: | 24700 W Mcbean Pky, Valencia, CA 91355-2397 |
| Phone: | 661-255-1050 |
| Website: | https://www.calarts.edu/ |
| Most Popular Majors | Bachelor’s Degrees | Average Salary of Graduates |
|---|---|---|
| Graphic Communications | 70 | NA |
| Music | 53 | $18,896 |
| Drama & Theater Arts | 52 | $22,673 |
| Film, Video & Photographic Arts | 52 | $28,247 |
| Fine & Studio Arts | 37 | NA |
| Dance | 17 | NA |
| Design & Applied Arts | 15 | NA |
| Computer Software & Applications | 14 | NA |
| Arts & Media Management | 9 | NA |
| Writing Studies | 8 | NA |
Footnotes
*The racial-ethnic minorities count is calculated by taking the total number of students and subtracting white students, international students, and students whose race/ethnicity was unknown. This number is then divided by the total number of students at the school to obtain the racial-ethnic minorities percentage.
References
More about our data sources and methodologies.