 by our College Data Analytics Team
College Factual recognizes the best colleges and universities in its annual rankings. These rankings include categories for best overall colleges, best colleges for each major, best value schools, and much more.
Cincinnati College of Mortuary Science was awarded 8 badges in the 2025 rankings. The highest ranked major at the school is funeral & mortuary science.
Explore the best ranked schools for the programs you are most interested in.
Cincinnati College of Mortuary Science was not ranked in College Factual's 2025 Best Overall Colleges report. This could be for a number of reasons, including lack of data.
See all of the rankings for Cincinnati College of Mortuary Science.
With a student to faculty ratio of 15 to 1, Cincinnati College of Mortuary Science is about average in this regard as the nationwide rate is 15 to 1. While this does not translate directly to class size, it's a good indicator of how much time professors will have to spend with their students on a one-on-one basis.
During the 2017-2018 academic year, there were 84 full-time undergraduates at Cincinnati College of Mortuary Science.

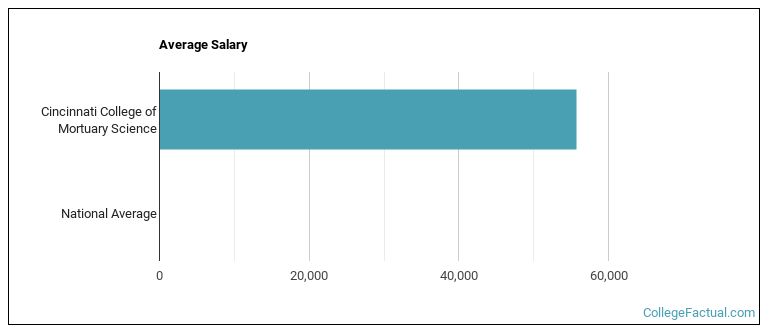
See which majors at Cincinnati College of Mortuary Science make the most money.
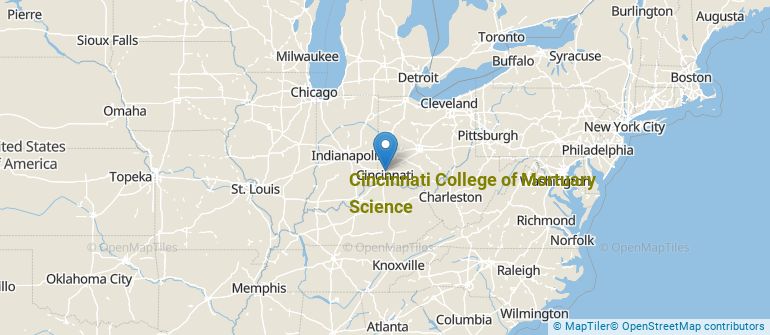
Get more details about the location of Cincinnati College of Mortuary Science.

Contact details for Cincinnati College of Mortuary Science are given below.
| Contact Details | |
|---|---|
| Address: | 645 W North Bend Rd, Cincinnati, OH 45224-1462 |
| Phone: | 513-761-2020 |
| Website: | www.ccms.edu/ |
| Most Popular Majors | Bachelor’s Degrees | Average Salary of Graduates |
|---|---|---|
| Funeral & Mortuary Science | 49 | $44,110 |
Footnotes
*The racial-ethnic minorities count is calculated by taking the total number of students and subtracting white students, international students, and students whose race/ethnicity was unknown. This number is then divided by the total number of students at the school to obtain the racial-ethnic minorities percentage.
References
More about our data sources and methodologies.