Here, you'll find out more about the major, including such details as the number of graduates, what degree levels are offered, ethnicity of students, average salaries, and more. In addition, we cover how Clemson ranks in comparison to other schools with political science programs.
Jump to any of the following sections:
Learn about start dates, transferring credits, availability of financial aid, and more by contacting the universities below.
Gain a solid understanding of American political history, the current political landscape, and the major political parties with this online bachelor's from Southern New Hampshire University.
The bachelor's program at Clemson was ranked #143 on College Factual's Best Schools for political science list. It is also ranked #2 in South Carolina.
| Ranking Type | Rank |
|---|---|
| Best Political Science & Government Schools | 143 |
| Best Political Science & Government Bachelor’s Degree Schools | 143 |
During the 2021-2022 academic year, Clemson University handed out 88 bachelor's degrees in political science & government. This is a decrease of 31% over the previous year when 127 degrees were handed out.
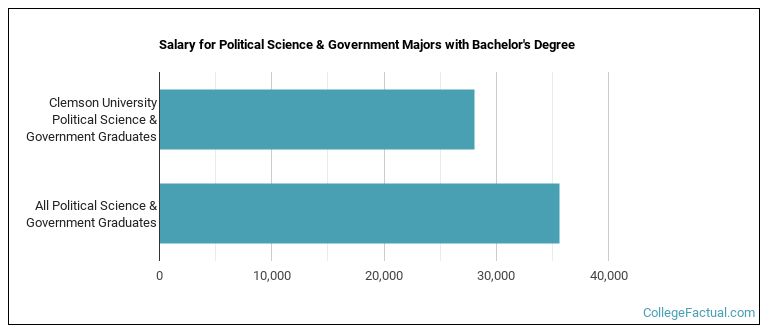
The median salary of political science students who receive their bachelor's degree at Clemson is $28,041. Unfortunately, this is lower than the national average of $35,631 for all political science students.
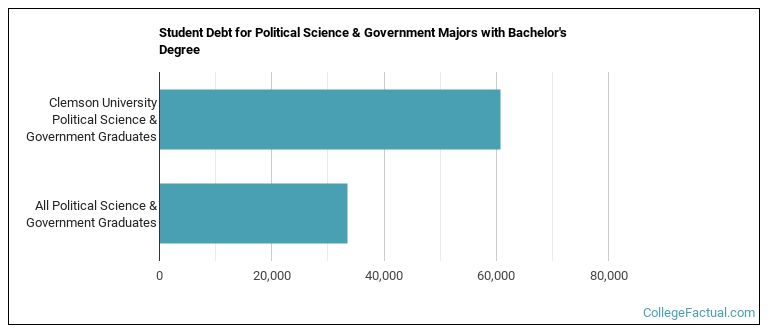
While getting their bachelor's degree at Clemson, political science students borrow a median amount of $60,735 in student loans. This is higher than the the typical median of $33,583 for all political science majors across the country.
The typical student loan payment of a bachelor's degree student from the political science program at Clemson is $742 per month.
In 2022-2023, the average part-time undergraduate tuition at Clemson was $1,695 per credit hour for out-of-state students. The average for in-state students was $654 per credit hour. The average full-time tuition and fees for undergraduates are shown in the table below.
| In State | Out of State | |
|---|---|---|
| Tuition | $14,038 | $37,982 |
| Fees | $1,516 | $1,516 |
| Books and Supplies | $1,436 | $1,436 |
| On Campus Room and Board | $12,872 | $12,872 |
| On Campus Other Expenses | $5,476 | $5,476 |
Learn more about Clemson tuition and fees.
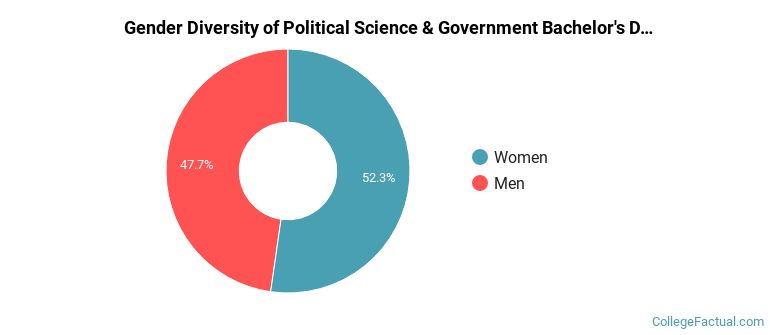
In the 2021-2022 academic year, 88 students earned a bachelor's degree in political science from Clemson. About 52% of these graduates were women and the other 48% were men.
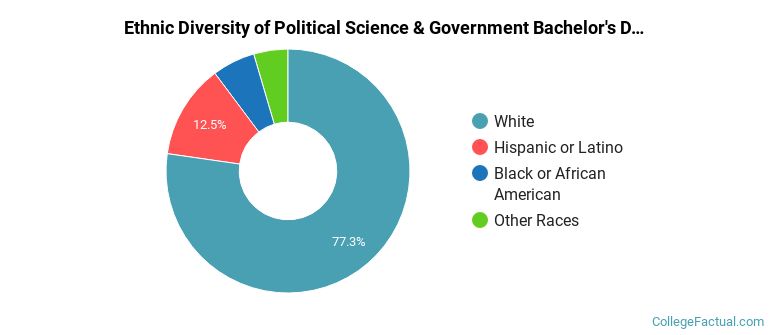
The majority of the students with this major are white. About 77% of 2022 graduates were in this category.
The following table and chart show the ethnic background for students who recently graduated from Clemson University with a bachelor's in political science.
| Ethnic Background | Number of Students |
|---|---|
| Asian | 0 |
| Black or African American | 5 |
| Hispanic or Latino | 11 |
| White | 68 |
| Non-Resident Aliens | 0 |
| Other Races | 4 |
Online degrees for the Clemson political science bachelor’s degree program are not available at this time. To see if the school offers distance learning options in other areas, visit the Clemson Online Learning page.
Take a look at the following statistics related to the make-up of the political science majors at Clemson University.
| Related Major | Annual Graduates |
|---|---|
| Economics | 161 |
| Sociology | 44 |
| Anthropology | 16 |
| Other Social Sciences | 7 |
More about our data sources and methodologies.
