
In its yearly rankings, College Factual analyzes over 2,000 colleges and universities to determine which ones are the best in a variety of categories, such as overall value, quality, diversity, which schools are the best for each major, and much more.
Cleveland Community College was awarded 18 badges in the 2025 rankings. The highest ranked major at the school is liberal arts / sciences & humanities.
Explore the best ranked schools for the programs you are most interested in.
According to College Factual's 2025 analysis, Cleveland Community College is ranked #1,015 out of 2,152 schools in the nation that were analyzed for overall quality.
Out of the 93 colleges in North Carolina, Cleveland Community College is ranked at #29.
Since Cleveland Community College has an open admissions policy, being accepted to the school isn't that hard. However, a full basic things - such as a high school diploma or equivalent - may be required. Also, go over your application to make sure it is complete before you submit it.
With a student to faculty ratio of 15 to 1, Cleveland Community College is about average in this regard as the nationwide rate is 15 to 1. While this does not translate directly to class size, it's a good indicator of how much time professors will have to spend with their students on a one-on-one basis.
When estimating how much access students will have to their teachers, some people like to look at what percentage of faculty members are full time. This is because part-time teachers may not have as much time to spend on campus as their full-time counterparts.
The full-time faculty percentage at Cleveland Community College is 21%. This is lower than the national average of 47%.
The freshmen retention rate is a measure of what percentage of first-year, full-time students come back for their sophomore year. The 22% rate at Cleveland Community College is a good bit lower than the national rate of 68%. This could be for a number of reasons, such as students transferring after a year because they changed majors.
During the 2017-2018 academic year, there were 2,269 undergraduates at Cleveland Community College with 686 being full-time and 1,583 being part-time.
The net price is calculated by adding tuition, room, board and other costs and subtracting financial aid.Note that the net price is typically less than the published for a school. For more information on the sticker price of Cleveland Community College, see our tuition and fees and room and board pages.
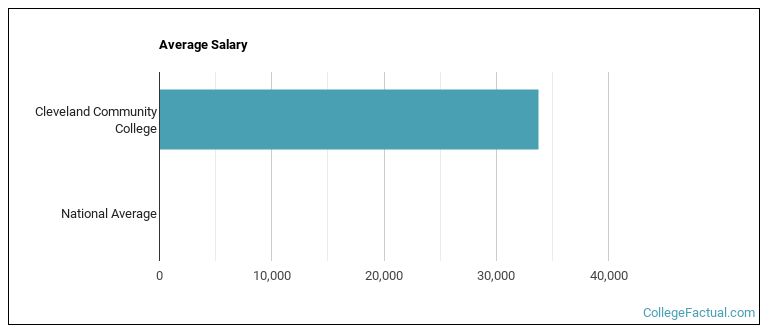
See which majors at Cleveland Community College make the most money.
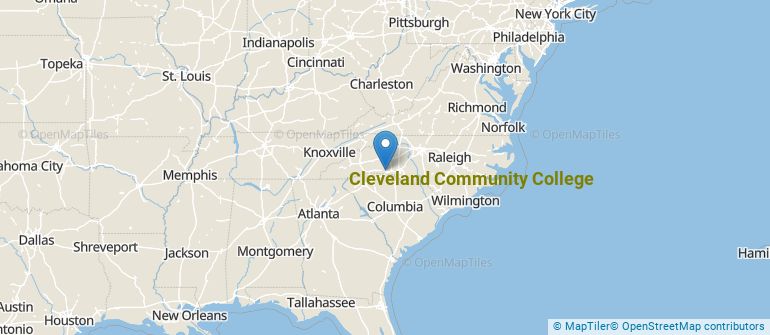
Get more details about the location of Cleveland Community College.
Contact details for Cleveland Community College are given below.
| Contact Details | |
|---|---|
| Address: | 137 S Post Rd, Shelby, NC 28152-6224 |
| Phone: | 704-669-4081 |
| Website: | www.clevelandcc.edu/ |
| Most Popular Majors | Bachelor’s Degrees | Average Salary of Graduates |
|---|---|---|
| Liberal Arts General Studies | 311 | NA |
| Teacher Education Grade Specific | 90 | NA |
| Cosmetology | 72 | NA |
| Computer Information Systems | 49 | NA |
| Electromechanical Engineering Technology | 49 | NA |
| Precision Metal Working | 49 | NA |
| Criminal Justice & Corrections | 45 | NA |
| Business Administration & Management | 42 | NA |
| Health & Medical Administrative Services | 40 | NA |
| Heating, Air Conditioning, Ventilation & Refrigeration | 33 | NA |
Online courses area a great option for busy, working students as well as for those who have scheduling conflicts and want to study on their own time. As time goes by, expect to see more and more online learning options become available.
In 2022-2023, 1,791 students took at least one online class at Cleveland Community College. This is an increase from the 1,651 students who took online classes the previous year.
| Year | Took at Least One Online Class | Took All Classes Online |
|---|---|---|
| 2022-2023 | 1,791 | 1,023 |
| 2021-2022 | 1,651 | 898 |
| 2020-2021 | 2,248 | 2,177 |
| 2018-2019 | 1,593 | 757 |
Learn more about online learning at Cleveland Community College.
Footnotes
*The racial-ethnic minorities count is calculated by taking the total number of students and subtracting white students, international students, and students whose race/ethnicity was unknown. This number is then divided by the total number of students at the school to obtain the racial-ethnic minorities percentage.
References
More about our data sources and methodologies.