In its yearly rankings, College Factual analyzes over 2,000 colleges and universities to determine which ones are the best in a variety of categories, such as overall value, quality, diversity, which schools are the best for each major, and much more.
College of the Desert was awarded 10 badges in the 2025 rankings. The highest ranked major at the school is criminal justice & corrections.
Explore the best ranked schools for the programs you are most interested in.
College of the Desert landed the #602 spot in College Factual's 2025 ranking of best overall colleges in the United States. The higher ed experts analyzed 2,152 colleges and universities across the nation to determine this ranking. This is an improvement over the previous year, when College of the Desert held the #1,647 spot on the Best Overall Colleges list.
Out of the 161 colleges in California, College of the Desert is ranked at #75.
If you are worried about getting into College of the Desert, don't be. The school has a liberal open admissions policy, which means you only need to meet basic requirements in order to be admitted. Still, be sure to submit a complete application and provide any other requested materials.
The student to faculty ratio at College of the Desert is 26 to 1, which is high when compared to the national average of 15 to 1. This may indicate that some of your classes will be larger in size than they would be at other schools. However, upper level classes will probably be smaller.
When estimating how much access students will have to their teachers, some people like to look at what percentage of faculty members are full time. This is because part-time teachers may not have as much time to spend on campus as their full-time counterparts.
The full-time faculty percentage at College of the Desert is 26%. This is lower than the national average of 47%.
The freshmen retention rate tells us what percentage of first-year, full-time students choose to continue on to their sophomore year at a particular school. The rate at College of the Desert is 64%, which is about average when compared to the national rate of 68%.
During the 2017-2018 academic year, there were 10,932 undergraduates at College of the Desert with 4,197 being full-time and 6,735 being part-time.
| $0-30 K | $30K-48K | $48-75 | $75-110K | $110K + |
|---|---|---|---|---|
| $10,374 | $10,899 | $13,258 | $15,422 | $10,850 |
The net price is calculated by adding tuition, room, board and other costs and subtracting financial aid.Note that the net price is typically less than the published for a school. For more information on the sticker price of College of the Desert, see our tuition and fees and room and board pages.
The student loan default rate at College of the Desert is 1.0%. This is significantly lower than the national default rate of 10.1%, which is a good sign that you'll be able to pay back your student loans.
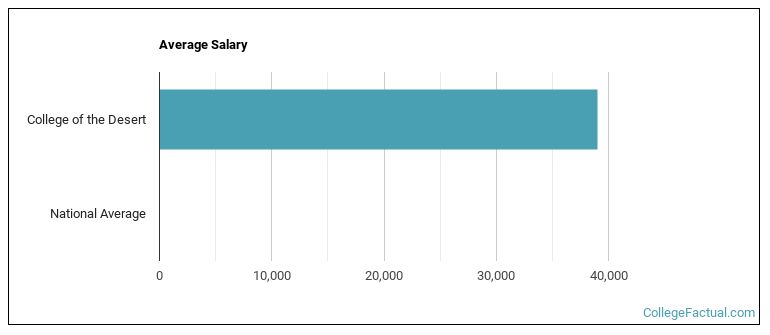
See which majors at College of the Desert make the most money.
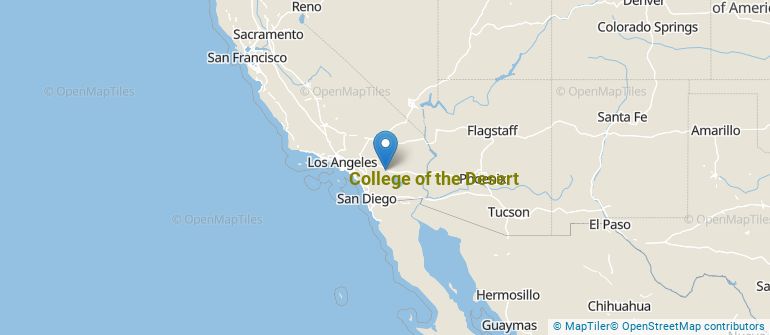
Get more details about the location of College of the Desert.
Contact details for College of the Desert are given below.
| Contact Details | |
|---|---|
| Address: | 43-500 Monterey Ave, Palm Desert, CA 92260 |
| Phone: | 760-346-8041 |
| Website: | www.collegeofthedesert.edu/ |
| Most Popular Majors | Bachelor’s Degrees | Average Salary of Graduates |
|---|---|---|
| Liberal Arts General Studies | 800 | NA |
| Teacher Education Grade Specific | 194 | NA |
| General Psychology | 178 | NA |
| Business Administration & Management | 175 | NA |
| Health/Medical Prep Programs | 111 | NA |
| Criminal Justice & Corrections | 95 | NA |
| Environmental Control Technology | 66 | NA |
| Nursing | 64 | NA |
| Sociology | 61 | NA |
| Health & Physical Education | 49 | NA |
Online courses area a great option for busy, working students as well as for those who have scheduling conflicts and want to study on their own time. As time goes by, expect to see more and more online learning options become available.
In 2022-2023, 7,646 students took at least one online class at College of the Desert. This is a decrease from the 8,965 students who took online classes the previous year.
| Year | Took at Least One Online Class | Took All Classes Online |
|---|---|---|
| 2022-2023 | 7,646 | 4,078 |
| 2021-2022 | 8,965 | 7,621 |
| 2020-2021 | 10,909 | 10,522 |
| 2018-2019 | 3,132 | 798 |
Footnotes
*The racial-ethnic minorities count is calculated by taking the total number of students and subtracting white students, international students, and students whose race/ethnicity was unknown. This number is then divided by the total number of students at the school to obtain the racial-ethnic minorities percentage.
References
More about our data sources and methodologies.