College Factual recognizes the best colleges and universities in its annual rankings. These rankings include categories for best overall colleges, best colleges for each major, best value schools, and much more.
Colorado College was awarded 1 badge in the 2025 rankings. The highest ranked major at the school is econometrics & quantitative economics.
Explore the best ranked schools for the programs you are most interested in.
Colorado College landed the #560 spot in College Factual's 2025 ranking of best overall colleges in the United States. The higher ed experts analyzed 2,152 colleges and universities across the nation to determine this ranking.
Colorado College also holds the #10 spot on the Best Colleges in Colorado ranking.
Colorado College has a very low acceptance rate of 16%, making it one of the most selective out of all the colleges and universities in the nation. It's probably a good idea to apply to other schools in addition to Colorado College just in case you don't make the cut.
About 34% of students accepted to Colorado College submitted their SAT scores. When looking at the 25th through the 75th percentile, SAT Evidence-Based Reading and Writing scores ranged between 640 and 730. Math scores were between 620 and 750.
At Colorado College, the student to faculty ratio is an excellent 10 to 1. That's much better than the national average of 15 to 1. This indicates that many classes will probably be small, and students will have ample opportunites to work closely with their professors and classmates.
In addition to the student to faculty ratio, some people look at what percentage of faculty members are full-time as a sign of how much time professors will be able to spend with their students. This is because part-time teachers may not be be on campus as much as their full-time counterparts.
The full-time faculty percentage at Colorado College is 82%. This is higher than the national average of 47%.
The freshmen retention rate of 91% tells us that most first-year, full-time students like Colorado College enough to come back for another year. This is a fair bit higher than the national average of 68%. That's certainly something to check off in the good column about the school.
Students are considered to have graduated on time if they finish their studies within four years. At Colorado College the on-time graduation rate of first-time, full-time students is 82%. That is great when compared to the national average of 33.3%
Find out more about the retention and graduation rates at Colorado College.
During the 2017-2018 academic year, there were 2,025 undergraduates at Colorado College with 1,886 being full-time and 139 being part-time.
| $0-30 K | $30K-48K | $48-75 | $75-110K | $110K + |
|---|---|---|---|---|
| $10,762 | $9,664 | $13,311 | $30,471 | $47,237 |
The net price is calculated by adding tuition, room, board and other costs and subtracting financial aid.Note that the net price is typically less than the published for a school. For more information on the sticker price of Colorado College, see our tuition and fees and room and board pages.
Almost 66% of college students who graduated with the class of 2018 took out student loans, but that percentage varies from school to school. At Colorado College, approximately 25% of students took out student loans averaging $6,626 a year. That adds up to $26,504 over four years for those students.
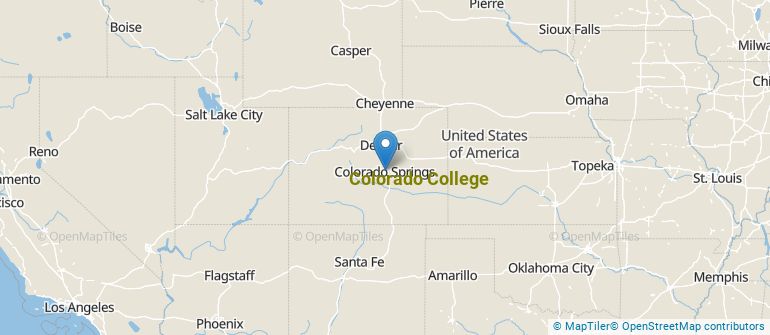
Get more details about the location of Colorado College.
Contact details for Colorado College are given below.
| Contact Details | |
|---|---|
| Address: | 14. E Cache La Poudre St., Colorado Springs, CO 80903 |
| Phone: | 719-389-6000 |
| Website: | www.coloradocollege.edu/ |
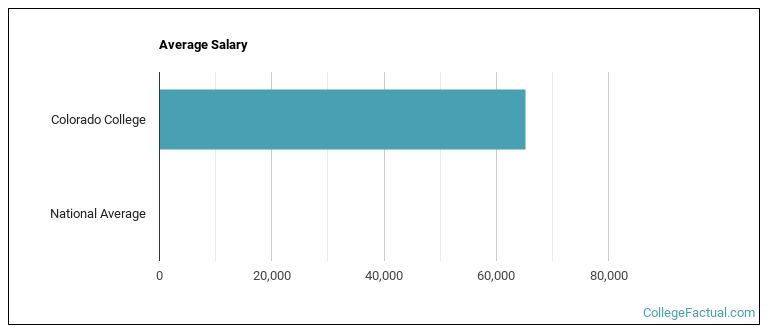
| Most Popular Majors | Bachelor’s Degrees | Average Salary of Graduates |
|---|---|---|
| Economics | 60 | $58,082 |
| Religious Studies | 51 | NA |
| Political Science & Government | 51 | NA |
| Natural Resources Conservation | 43 | $17,372 |
| Other Multi/Interdisciplinary Studies | 33 | NA |
| Ecology, Evolution & Systematics Biology | 31 | NA |
| History | 30 | NA |
| General Psychology | 28 | NA |
| Cell Biology & Anatomical Sciences | 24 | NA |
| Neurobiology & Neurosciences | 24 | NA |
This is a decrease from the 33 students who took online classes the previous year.
Footnotes
*The racial-ethnic minorities count is calculated by taking the total number of students and subtracting white students, international students, and students whose race/ethnicity was unknown. This number is then divided by the total number of students at the school to obtain the racial-ethnic minorities percentage.
References
More about our data sources and methodologies.