Explore the best ranked schools for the programs you are most interested in.
According to College Factual's 2025 analysis, Fontbonne University is ranked #1,526 out of 2,152 schools in the nation that were analyzed for overall quality.
Fontbonne University also holds the #27 spot on the Best Colleges in Missouri ranking.
With an acceptance rate of 94%, Fontbonne University is easier to get into than many other schools. But that doesn't mean you can slack off on your application. Make sure to treat this school like any other when submitting requested materials and documents.
The student to faculty ratio at Fontbonne University is an impressive 9 to 1. That's quite good when you compare it to the national average of 15 to 1. This is a good sign that students at the school will have more opportunities for one-on-one interactions with their professors.
When estimating how much access students will have to their teachers, some people like to look at what percentage of faculty members are full time. This is because part-time teachers may not have as much time to spend on campus as their full-time counterparts.
The full-time faculty percentage at Fontbonne University is 42%. This is lower than the national average of 47%.
The freshmen retention rate tells us what percentage of first-year, full-time students choose to continue on to their sophomore year at a particular school. The rate at Fontbonne University is 72%, which is about average when compared to the national rate of 68%.
The on-time graduation rate for someone pursuing a bachelor's degree is typically four years. This rate at Fontbonne University for first-time, full-time students is 49%, which is better than the national average of 33.3%.
Find out more about the retention and graduation rates at Fontbonne University.
During the 2017-2018 academic year, there were 816 undergraduates at Fontbonne University with 728 being full-time and 88 being part-time.
| $0-30 K | $30K-48K | $48-75 | $75-110K | $110K + |
|---|---|---|---|---|
| $14,424 | $13,458 | $18,104 | $24,146 | $25,000 |
The net price is calculated by adding tuition, room, board and other costs and subtracting financial aid.Note that the net price is typically less than the published for a school. For more information on the sticker price of Fontbonne University, see our tuition and fees and room and board pages.
While almost two-thirds of students nationwide take out loans to pay for college, the percentage may be quite different for the school you plan on attending. At Fontbonne University, approximately 65% of students took out student loans averaging $7,776 a year. That adds up to $31,104 over four years for those students.
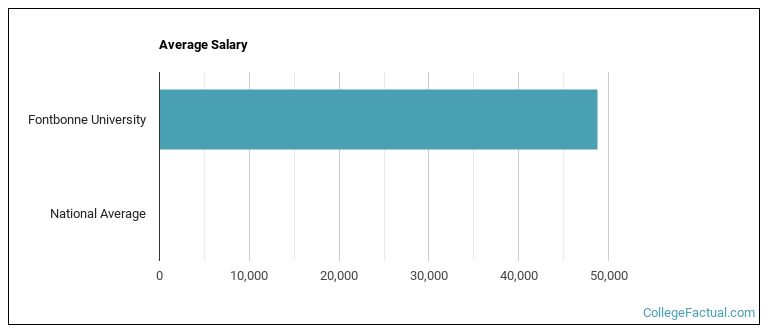
See which majors at Fontbonne University make the most money.
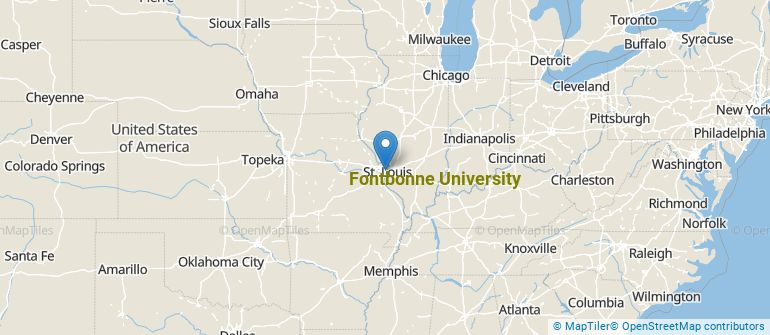
Get more details about the location of Fontbonne University.
Contact details for Fontbonne University are given below.
| Contact Details | |
|---|---|
| Address: | 6800 Wydown Blvd, Saint Louis, MO 63105-3098 |
| Phone: | 314-862-3456 |
| Website: | https://www.fontbonne.edu/ |
| Most Popular Majors | Bachelor’s Degrees | Average Salary of Graduates |
|---|---|---|
| Communication Sciences | 42 | NA |
| Business Administration & Management | 41 | NA |
| Special Education | 26 | $36,791 |
| Liberal Arts General Studies | 17 | NA |
| Public Health | 14 | NA |
| Social Work | 11 | NA |
| Information Technology | 10 | NA |
| Dietetics & Clinical Nutrition Services | 9 | NA |
| General Biology | 8 | NA |
| General Education | 8 | NA |
Online courses area a great option for busy, working students as well as for those who have scheduling conflicts and want to study on their own time. As time goes by, expect to see more and more online learning options become available.
In 2022-2023, 786 students took at least one online class at Fontbonne University. This is an increase from the 758 students who took online classes the previous year.
| Year | Took at Least One Online Class | Took All Classes Online |
|---|---|---|
| 2022-2023 | 786 | 142 |
| 2021-2022 | 758 | 196 |
| 2020-2021 | 1,018 | 307 |
| 2018-2019 | 753 | 189 |
Footnotes
*The racial-ethnic minorities count is calculated by taking the total number of students and subtracting white students, international students, and students whose race/ethnicity was unknown. This number is then divided by the total number of students at the school to obtain the racial-ethnic minorities percentage.
References
More about our data sources and methodologies.