Explore the best ranked schools for the programs you are most interested in.
FLC landed the #1,776 spot in College Factual's 2025 ranking of best overall colleges in the United States. The higher ed experts analyzed 2,152 colleges and universities across the nation to determine this ranking.
FLC also holds the #28 spot on the Best Colleges in Colorado ranking.
With an acceptance rate of 91%, FLC has a fairly liberal admissions policy. However, don't just assume you'll get in! Put together a good application and make sure you include all requested documents and materials.
About 19% of students accepted to FLC submitted their SAT scores. When looking at the 25th through the 75th percentile, SAT Evidence-Based Reading and Writing scores ranged between 530 and 640. Math scores were between 530 and 620.
With a student to faculty ratio of 15 to 1, Fort Lewis College is about average in this regard as the nationwide rate is 15 to 1. While this does not translate directly to class size, it's a good indicator of how much time professors will have to spend with their students on a one-on-one basis.
In addition to the student to faculty ratio, some people look at what percentage of faculty members are full-time as a sign of how much time professors will be able to spend with their students. This is because part-time teachers may not be be on campus as much as their full-time counterparts.
The full-time faculty percentage at Fort Lewis College is 75%. This is higher than the national average of 47%.
The freshmen retention rate is a sign of how many full-time students like a college or university well enough to come back for their sophomore year. At Fort Lewis College this rate is 59%, which is a bit lower than the national average of 68%.
When it comes to finishing their studies on time, those seeking a bachelor's degree from FLC have a four-year graduation rate of 29%. This is comparable to the national average of 33.3%
Find out more about the retention and graduation rates at Fort Lewis College.
During the 2017-2018 academic year, there were 3,359 undergraduates at FLC with 2,904 being full-time and 455 being part-time.
| $0-30 K | $30K-48K | $48-75 | $75-110K | $110K + |
|---|---|---|---|---|
| $10,551 | $11,793 | $13,569 | $18,137 | $20,639 |
The net price is calculated by adding tuition, room, board and other costs and subtracting financial aid.Note that the net price is typically less than the published for a school. For more information on the sticker price of FLC, see our tuition and fees and room and board pages.
Almost 66% of college students who graduated with the class of 2018 took out student loans, but that percentage varies from school to school. At FLC, approximately 36% of students took out student loans averaging $5,482 a year. That adds up to $21,928 over four years for those students.
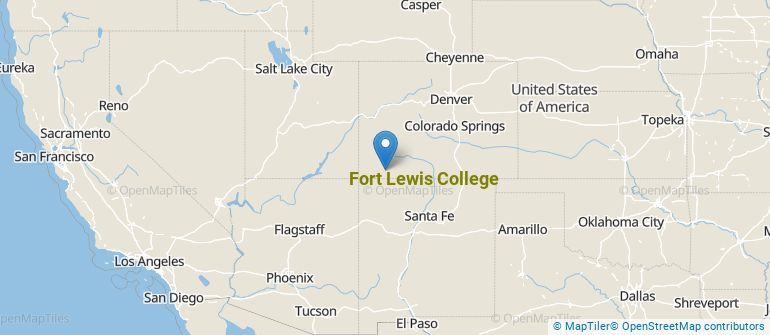
Get more details about the location of Fort Lewis College.
Contact details for FLC are given below.
| Contact Details | |
|---|---|
| Address: | 1000 Rim Drive, Durango, CO 81301-3999 |
| Phone: | 970-247-7010 |
| Website: | fortlewis.edu/ |
| Facebook: | http://www.facebook.com/FortLewis |
| Twitter: | https://twitter.com/FLCDurango |
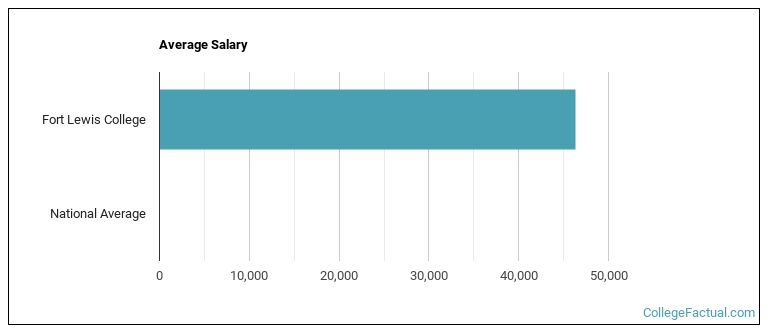
| Most Popular Majors | Bachelor’s Degrees | Average Salary of Graduates |
|---|---|---|
| General Business/Commerce | 64 | $33,376 |
| Health & Physical Education | 49 | $24,419 |
| General Psychology | 48 | $27,019 |
| Natural Resources Conservation | 41 | $22,541 |
| General Biology | 33 | $26,350 |
| General Engineering | 29 | $50,985 |
| Sociology | 28 | $27,553 |
| General English Literature | 22 | $25,718 |
| Health Sciences & Services | 22 | NA |
| Outdoor Education | 21 | $25,514 |
Online learning options are becoming more and more popular at American colleges and universities. Online classes are great for students who have busy schedules or for those who just want to study on their own time.
In 2022-2023, 1,278 students took at least one online class at Fort Lewis College. This is a decrease from the 1,410 students who took online classes the previous year.
| Year | Took at Least One Online Class | Took All Classes Online |
|---|---|---|
| 2022-2023 | 1,278 | 152 |
| 2021-2022 | 1,410 | 161 |
| 2020-2021 | 1,829 | 189 |
| 2018-2019 | 262 | 24 |
If you’re considering Fort Lewis College, here are some more schools you may be interested in knowing more about.
Curious on how these schools stack up against FLC? Pit them head to head with College Combat, our free interactive tool that lets you compare college on the features that matter most to you!
Footnotes
*The racial-ethnic minorities count is calculated by taking the total number of students and subtracting white students, international students, and students whose race/ethnicity was unknown. This number is then divided by the total number of students at the school to obtain the racial-ethnic minorities percentage.
References
More about our data sources and methodologies.