Jump to any of the following sections:
The bachelor's program at Framingham State was ranked #263 on College Factual's Best Schools for elementary teaching list. It is also ranked #10 in Massachusetts.
During the 2020-2021 academic year, Framingham State University handed out 25 bachelor's degrees in elementary education. This is an increase of 25% over the previous year when 20 degrees were handed out.
In 2021, 2 students received their master’s degree in elementary teaching from Framingham State. This makes it the #275 most popular school for elementary teaching master’s degree candidates in the country.
Learn about other programs related to Elementary Education that might interest you.
Take a look at the following statistics related to the make-up of the elementary teaching majors at Framingham State University.
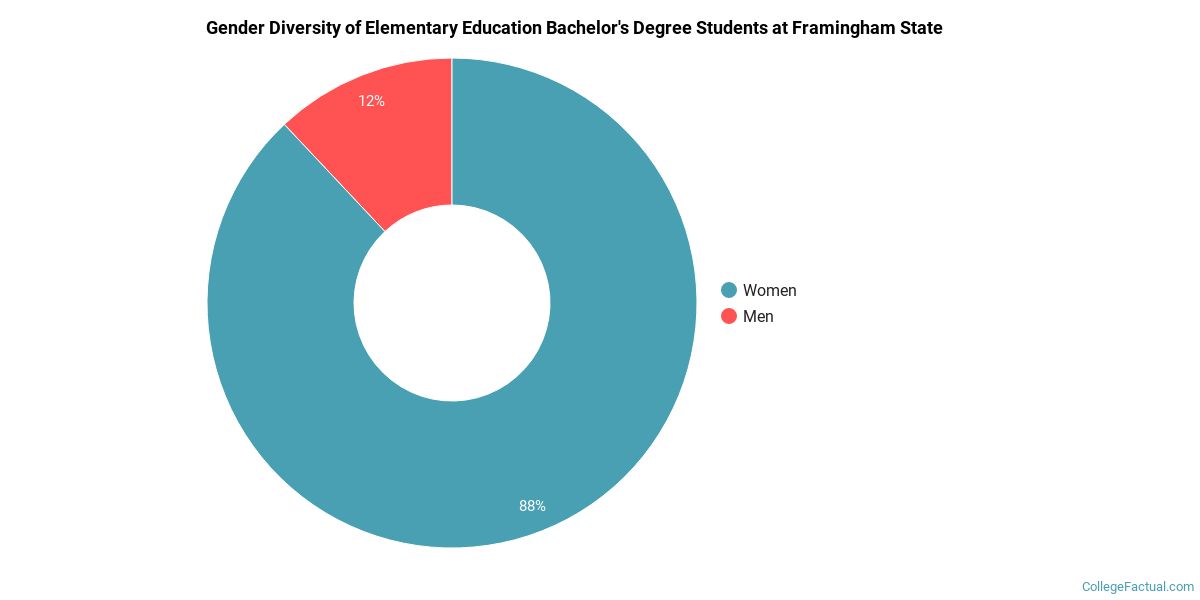
In the 2020-2021 academic year, 25 students earned a bachelor's degree in elementary teaching from Framingham State. About 88% of these graduates were women and the other 12% were men.
The majority of bachelor's degree recipients in this major at Framingham State are white. In the most recent graduating class for which data is available, 92% of students fell into this category.
The following table and chart show the ethnic background for students who recently graduated from Framingham State University with a bachelor's in elementary teaching.

| Ethnic Background | Number of Students |
|---|---|
| Asian | 0 |
| Black or African American | 0 |
| Hispanic or Latino | 0 |
| White | 23 |
| Non-Resident Aliens | 0 |
| Other Races | 2 |
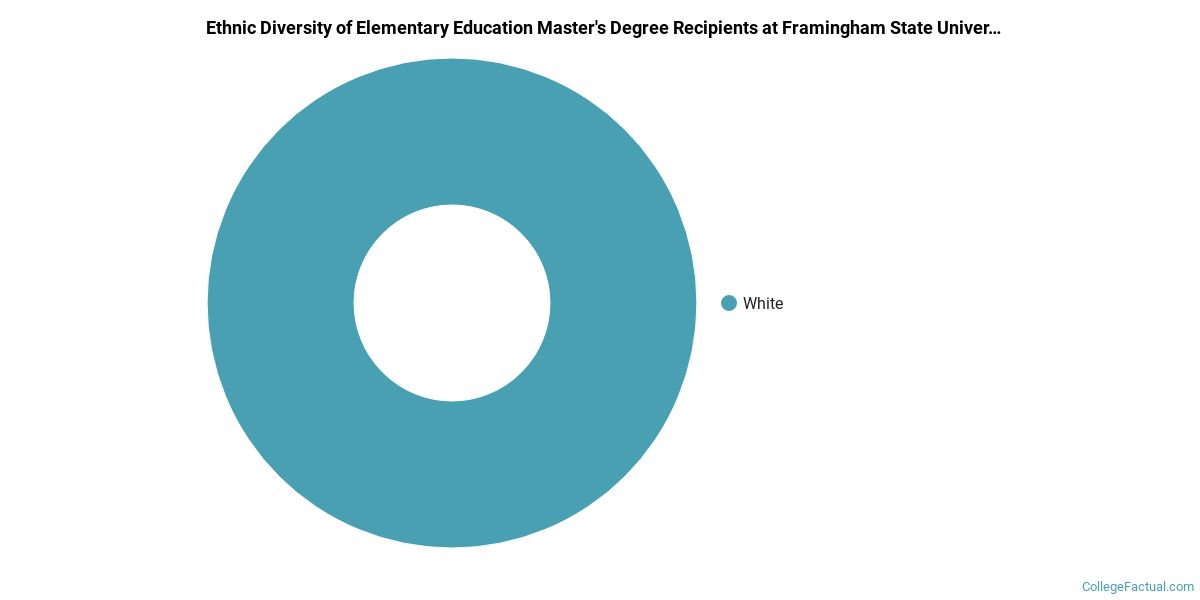
All of the 2 students who graduated with a Master’s in elementary teaching from Framingham State in 2021 were women.

The majority of the students with this major are white. About 100% of 2021 graduates were in this category.
The following table and chart show the ethnic background for students who recently graduated from Framingham State University with a master's in elementary teaching.
| Ethnic Background | Number of Students |
|---|---|
| Asian | 0 |
| Black or African American | 0 |
| Hispanic or Latino | 0 |
| White | 2 |
| Non-Resident Aliens | 0 |
| Other Races | 0 |
| Related Major | Annual Graduates |
|---|---|
| Early Childhood Education | 24 |
| Secondary Education | 12 |
More about our data sources and methodologies.
