GMU total enrollment is approximately 38,541 students. 21,603 are undergraduates and 4,428 are graduate students.
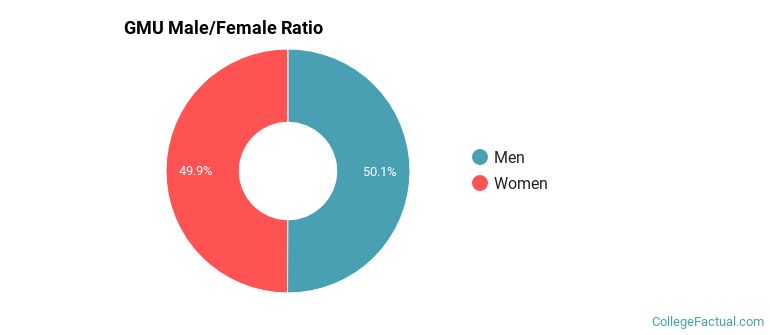
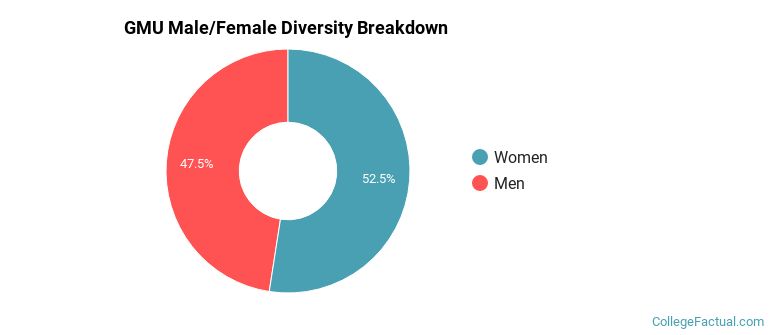
Male/Female Breakdown of Undergraduates
The full-time GMU undergraduate population is made up of 50% women, and 50% men.
For the gender breakdown for all students, go here.
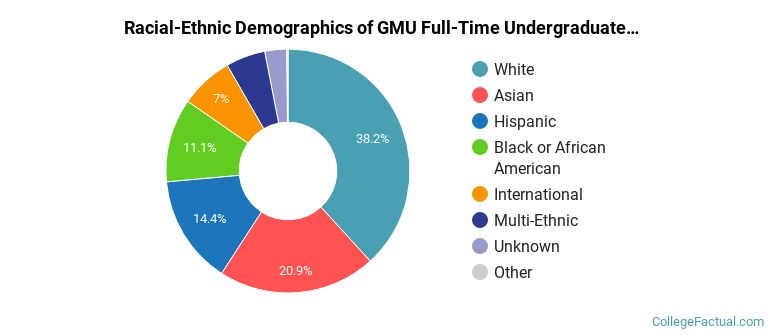
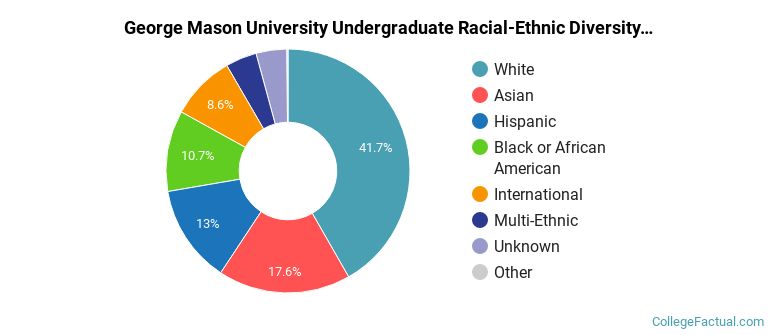
GMU Racial/Ethnic Breakdown of Undergraduates
| Race/Ethnicity | Number |
|---|---|
| White | 7,970 |
| Asian | 4,734 |
| Hispanic | 3,288 |
| Black or African American | 2,490 |
| International | 1,245 |
| Multi-Ethnic | 1,146 |
| Unknown | 679 |
| Native Hawaiian or Pacific Islander | 27 |
See racial/ethnic breakdown for all students.
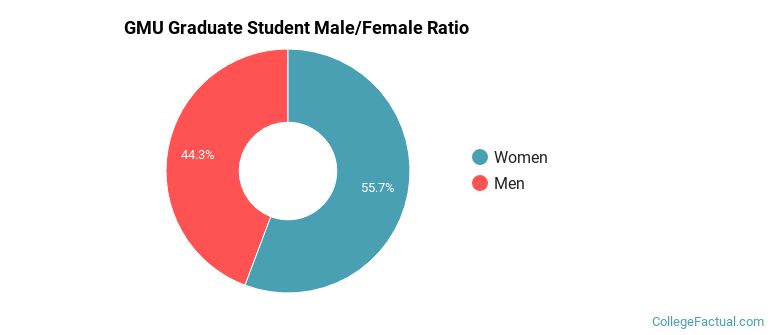
Male/Female Breakdown of Graduate Students
About 56% of full-time grad students are women, and 44% men.
For the gender breakdown for all students, go here.
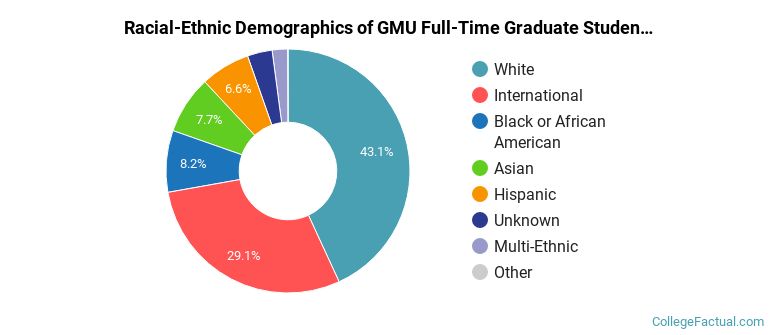
GMU Racial-Ethnic Breakdown of Graduate Students
| Race/Ethnicity | Number |
|---|---|
| White | 1,927 |
| International | 1,095 |
| Asian | 414 |
| Black or African American | 368 |
| Hispanic | 357 |
| Unknown | 187 |
| Multi-Ethnic | 72 |
| Native Hawaiian or Pacific Islander | 2 |
See racial/ethnic breakdown for all students.
| Race/Ethnicity | Number |
|---|---|
| White | 15,554 |
| Asian | 7,094 |
| Hispanic | 5,348 |
| Black or African American | 4,246 |
| International | 2,774 |
| Unknown | 1,833 |
| Multi-Ethnic | 1,577 |
| Native Hawaiian or Pacific Islander | 56 |
There are approximately 20,202 female students and 18,339 male students at GMU.
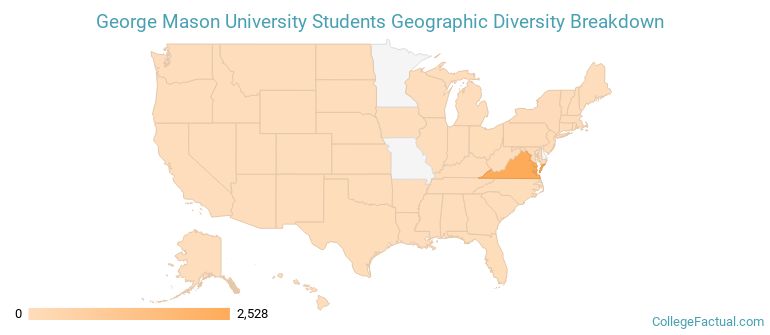
GMU ranks 646 out of 2,183 when it comes to geographic diversity.
17.19% of GMU students come from out of state, and 1.84% come from out of the country.
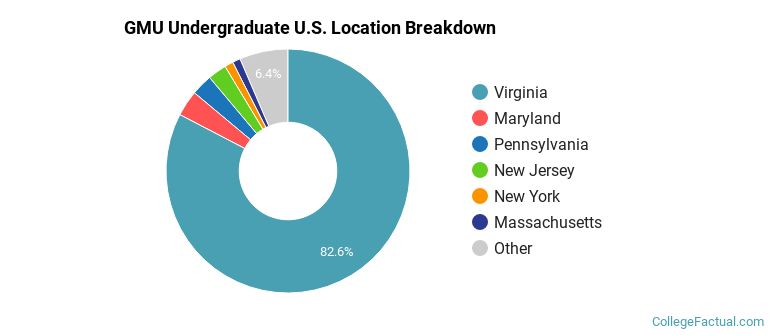
The undergraduate student body is split among 41 states (may include Washington D.C.). Click on the map for more detail.
| State | Amount |
|---|---|
| Virginia | 2,528 |
| Maryland | 105 |
| Pennsylvania | 86 |
| New Jersey | 76 |
| New York | 35 |
Students from 126 countries are represented at this school, with the majority of the international students coming from China, India, and Saudi Arabia.
Learn more about international students at GMU.
A traditional college student is defined as being between the ages of 18-21. At GMU, 39.03% of students fall into that category, compared to the national average of 60%.
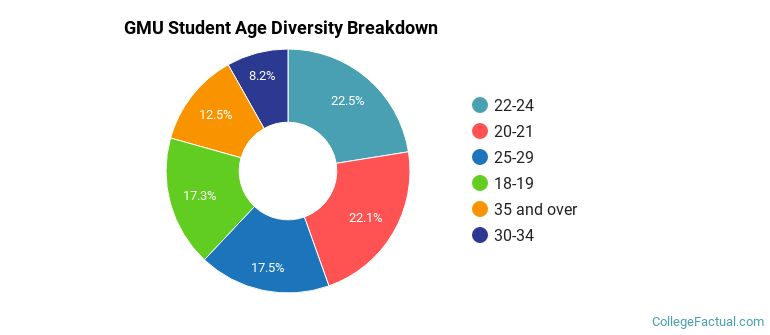
| Student Age Group | Amount |
|---|---|
| 22-24 | 8,013 |
| 20-21 | 7,866 |
| 25-29 | 6,221 |
| 18-19 | 6,180 |
| 35 and over | 4,448 |
| 30-34 | 2,909 |
| Under 18 | 0 |
Footnotes
*The racial-ethnic minorities count is calculated by taking the total number of students and subtracting white students, international students, and students whose race/ethnicity was unknown. This number is then divided by the total number of students at the school to obtain the racial-ethnic minorities percentage.
References
Department of Homeland Security Citizenship and Immigration Services
Image Credit: By Lucien Dalarun under License
Learn more about how College Factual creates their Diversity Rankings.