Explore the best ranked schools for the programs you are most interested in.
Gurnick Academy of Medical Arts was not ranked in College Factual's Best Overall Colleges report this year. This may be because not enough data was available.
See all of the rankings for Gurnick Academy of Medical Arts.
Gurnick Academy of Medical Arts has an open admissions policy, so you should not have much trouble being accepted by the school. Still, it is important to fill out the application completely and submit any requested materials, which may include proof that you have a high school diploma or the equivalent.
With a student to faculty ratio of 15 to 1, Gurnick Academy of Medical Arts is about average in this regard as the nationwide rate is 15 to 1. While this does not translate directly to class size, it's a good indicator of how much time professors will have to spend with their students on a one-on-one basis.
In addition to the student to faculty ratio, some people look at what percentage of faculty members are full-time as a sign of how much time professors will be able to spend with their students. This is because part-time teachers may not be be on campus as much as their full-time counterparts.
The full-time faculty percentage at Gurnick Academy of Medical Arts is 43%. This is lower than the national average of 47%.
The freshmen retention rate of 86% tells us that most first-year, full-time students like Gurnick Academy of Medical Arts enough to come back for another year. This is a fair bit higher than the national average of 68%. That's certainly something to check off in the good column about the school.
During the 2017-2018 academic year, there were 2,462 full-time undergraduates at Gurnick Academy of Medical Arts.
| $0-30 K | $30K-48K | $48-75 | $75-110K | $110K + |
|---|---|---|---|---|
| $27,451 | $28,058 | $29,839 | $32,463 | $32,581 |
The net price is calculated by adding tuition, room, board and other costs and subtracting financial aid.Note that the net price is typically less than the published for a school. For more information on the sticker price of Gurnick Academy of Medical Arts, see our tuition and fees and room and board pages.
Almost 66% of college students who graduated with the class of 2018 took out student loans, but that percentage varies from school to school. At Gurnick Academy of Medical Arts, approximately 46% of students took out student loans averaging $11,439 a year. That adds up to $45,756 over four years for those students.
Get more details about paying for Gurnick Academy of Medical Arts.
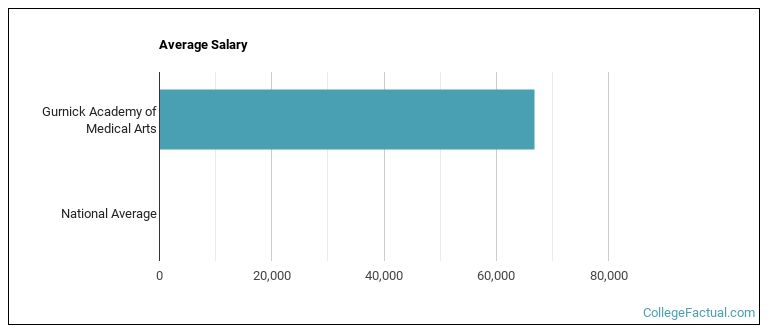
See which majors at Gurnick Academy of Medical Arts make the most money.
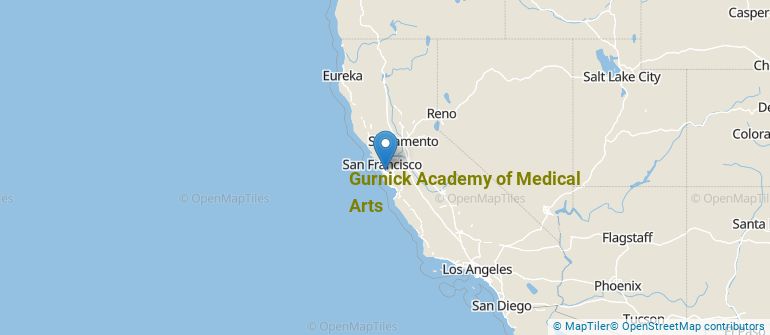
Get more details about the location of Gurnick Academy of Medical Arts.
Contact details for Gurnick Academy of Medical Arts are given below.
| Contact Details | |
|---|---|
| Address: | 1641 N. First Street, San Jose, CA 95112 |
| Phone: | 650-685-6616 |
| Website: | www.gurnick.edu/ |
| Most Popular Majors | Bachelor’s Degrees | Average Salary of Graduates |
|---|---|---|
| Practical Nursing & Nursing Assistants | 714 | NA |
| Allied Health Professions | 304 | NA |
| Nursing | 187 | NA |
| Allied Health & Medical Assisting Services | 184 | NA |
| Dental Support Services | 21 | NA |
| Mental & Social Health Services | 13 | NA |
| Veterinary/Animal Health Technologies/Technicians | 0 | NA |
Online learning options are becoming more and more popular at American colleges and universities. Online classes are great for students who have busy schedules or for those who just want to study on their own time.
In 2022-2023, 1,072 students took at least one online class at Gurnick Academy of Medical Arts. This is an increase from the 853 students who took online classes the previous year.
| Year | Took at Least One Online Class | Took All Classes Online |
|---|---|---|
| 2022-2023 | 1,072 | 471 |
| 2021-2022 | 853 | 508 |
| 2020-2021 | 590 | 388 |
| 2018-2019 | 313 | 164 |
Learn more about online learning at Gurnick Academy of Medical Arts.
Footnotes
*The racial-ethnic minorities count is calculated by taking the total number of students and subtracting white students, international students, and students whose race/ethnicity was unknown. This number is then divided by the total number of students at the school to obtain the racial-ethnic minorities percentage.
References
More about our data sources and methodologies.