
College Factual recognizes the best colleges and universities in its annual rankings. These rankings include categories for best overall colleges, best colleges for each major, best value schools, and much more.
Hobart and William Smith Colleges was awarded 1 badge in the 2025 rankings. The highest ranked major at the school is architecture & related services.
Explore the best ranked schools for the programs you are most interested in.
The Colleges is ranked #404 out of 2,152 schools in the nation for overall quality on College Factual's 2025 Best Colleges list. This puts it in the top 20% of all schools in the nation. This is an improvement over the previous year, when The Colleges held the #475 spot on the Best Overall Colleges list.
Out of the 136 colleges in New York, The Colleges is ranked at #42.
See all of the rankings for Hobart and William Smith Colleges.
Hobart and William Smith Colleges has an acceptance rate of 68%, which means the school is serious about who it admits. Take your time in putting together a strong application that highlights why you are a good fit for The Colleges.
About 22% of students accepted to The Colleges submitted their SAT scores. When looking at the 25th through the 75th percentile, SAT Evidence-Based Reading and Writing scores ranged between 610 and 700. Math scores were between 600 and 700.
Learn more about Hobart and William Smith Colleges admissions.
The student to faculty ratio is often used to measure the number of teaching resources that a college or university offers its students. The national average for this metric is 15 to 1, but at The Colleges it is much better at 8 to 1. That's good news for students who want to interact more on a personal level with their teachers.
In addition to the student to faculty ratio, some people look at what percentage of faculty members are full-time as a sign of how much time professors will be able to spend with their students. This is because part-time teachers may not be be on campus as much as their full-time counterparts.
The full-time faculty percentage at Hobart and William Smith Colleges is 100%. This is higher than the national average of 47%.
Hobart and William Smith Colleges has a freshmen retention rate of 87%. That's a good sign that full-time students like the school and their professors enough to want to stick around for another year. It's also a sign that the admissions team did a good job in choosing applicants who were a good fit for the school.
Students are considered to have graduated on time if they finish their studies within four years. At The Colleges the on-time graduation rate of first-time, full-time students is 72%. That is great when compared to the national average of 33.3%
Find out more about the retention and graduation rates at Hobart and William Smith Colleges.
During the 2017-2018 academic year, there were 1,824 undergraduates at The Colleges with 1,808 being full-time and 16 being part-time.
| $0-30 K | $30K-48K | $48-75 | $75-110K | $110K + |
|---|---|---|---|---|
| $19,352 | $11,523 | $19,653 | $22,959 | $40,907 |
The net price is calculated by adding tuition, room, board and other costs and subtracting financial aid.Note that the net price is typically less than the published for a school. For more information on the sticker price of The Colleges, see our tuition and fees and room and board pages.
Almost 66% of college students who graduated with the class of 2018 took out student loans, but that percentage varies from school to school. At The Colleges, approximately 60% of students took out student loans averaging $8,228 a year. That adds up to $32,912 over four years for those students.
Get more details about paying for Hobart and William Smith Colleges.
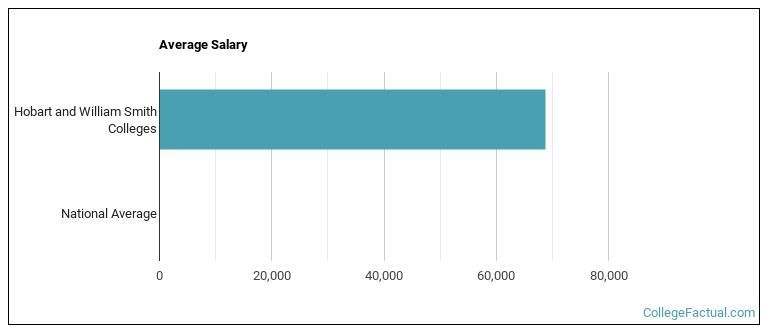
See which majors at Hobart and William Smith Colleges make the most money.
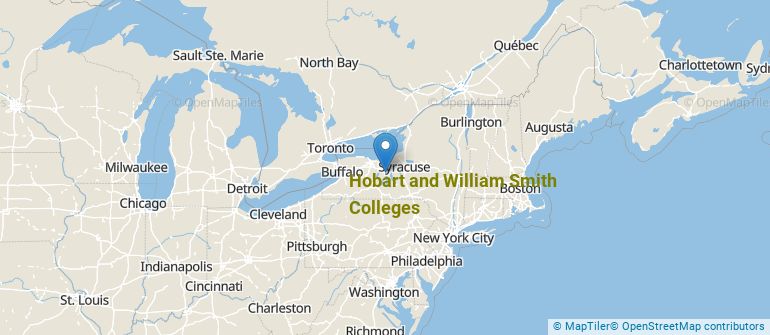
Get more details about the location of Hobart and William Smith Colleges.
Contact details for The Colleges are given below.
| Contact Details | |
|---|---|
| Address: | 337 Pulteney Street, Geneva, NY 14456 |
| Phone: | 315-781-3000 |
| Website: | www.hws.edu/ |
| Most Popular Majors | Bachelor’s Degrees | Average Salary of Graduates |
|---|---|---|
| Economics | 70 | $61,946 |
| Communication & Media Studies | 63 | $50,750 |
| Natural Resources Conservation | 54 | $43,671 |
| General Psychology | 42 | $38,117 |
| General Biology | 34 | $33,163 |
| Political Science & Government | 31 | $35,381 |
| History | 30 | $30,710 |
| Architecture (Other) | 26 | $29,900 |
| General English Literature | 24 | NA |
| Writing Studies | 22 | NA |
Footnotes
*The racial-ethnic minorities count is calculated by taking the total number of students and subtracting white students, international students, and students whose race/ethnicity was unknown. This number is then divided by the total number of students at the school to obtain the racial-ethnic minorities percentage.
References
More about our data sources and methodologies.