
College Factual recognizes the best colleges and universities in its annual rankings. These rankings include categories for best overall colleges, best colleges for each major, best value schools, and much more.
Irvine Valley College was awarded 10 badges in the 2025 rankings. The highest ranked major at the school is liberal arts / sciences & humanities.
Explore the best ranked schools for the programs you are most interested in.
Irvine Valley College is ranked #146 out of 2,152 schools in the nation for overall quality on College Factual's 2025 Best Colleges list. This puts it in the top 10% of all schools in the nation.
Out of the 161 colleges in California, Irvine Valley College is ranked at #19.
As long as you meet basic requirements, you should not have any trouble getting into Irvine Valley College since the school has an open admissions policy. Still, be sure to submit any requested materials and that your application is completed in full.
The student to faculty ratio is often used as a measure to gauge how much access students will have to their professors - the lower the number, the better. At Irvine Valley College, this rate is 28 to 1, which is high when compared to the national average of 15 to 1.
In addition to the student to faculty ratio, some people look at what percentage of faculty members are full-time as a sign of how much time professors will be able to spend with their students. This is because part-time teachers may not be be on campus as much as their full-time counterparts.
The full-time faculty percentage at Irvine Valley College is 32%. This is lower than the national average of 47%.
Irvine Valley College has a freshmen retention rate of 80%. That's a good sign that full-time students like the school and their professors enough to want to stick around for another year. It's also a sign that the admissions team did a good job in choosing applicants who were a good fit for the school.
During the 2017-2018 academic year, there were 12,199 undergraduates at Irvine Valley College with 4,201 being full-time and 7,998 being part-time.
| $0-30 K | $30K-48K | $48-75 | $75-110K | $110K + |
|---|---|---|---|---|
| $1,804 | $2,056 | $6,465 | $9,032 | $9,666 |
The net price is calculated by adding tuition, room, board and other costs and subtracting financial aid.Note that the net price is typically less than the published for a school. For more information on the sticker price of Irvine Valley College, see our tuition and fees and room and board pages.
Almost 66% of college students who graduated with the class of 2018 took out student loans, but that percentage varies from school to school. At Irvine Valley College, approximately 1% of students took out student loans averaging $3,208 a year. That adds up to $12,832 over four years for those students.
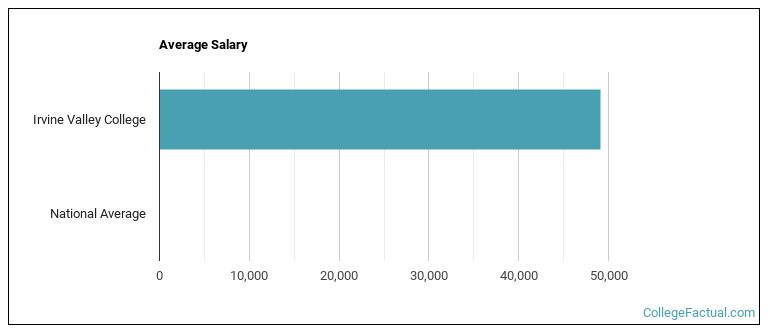
See which majors at Irvine Valley College make the most money.
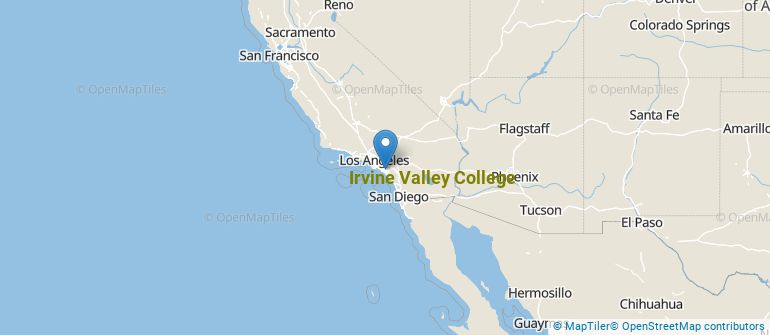
Get more details about the location of Irvine Valley College.
Contact details for Irvine Valley College are given below.
| Contact Details | |
|---|---|
| Address: | 5500 Irvine Center Drive, Irvine, CA 92618-0301 |
| Phone: | 949-451-5100 |
| Website: | https://www.ivc.edu/ |
| Most Popular Majors | Bachelor’s Degrees | Average Salary of Graduates |
|---|---|---|
| Liberal Arts General Studies | 3,458 | NA |
| Accounting | 486 | NA |
| Business Administration & Management | 406 | NA |
| Biological & Physical Science | 366 | NA |
| Real Estate | 360 | NA |
| Other Multi/Interdisciplinary Studies | 239 | NA |
| Entrepreneurial Studies | 233 | NA |
| Mathematics | 170 | NA |
| General Psychology | 156 | NA |
| Human Development & Family Studies | 134 | NA |
Online learning options are becoming more and more popular at American colleges and universities. Online classes are great for students who have busy schedules or for those who just want to study on their own time.
In 2022-2023, 8,383 students took at least one online class at Irvine Valley College. This is a decrease from the 8,625 students who took online classes the previous year.
| Year | Took at Least One Online Class | Took All Classes Online |
|---|---|---|
| 2022-2023 | 8,383 | 4,411 |
| 2021-2022 | 8,625 | 3,715 |
| 2020-2021 | 6,809 | 1,981 |
| 2018-2019 | 5,216 | 1,605 |
Footnotes
*The racial-ethnic minorities count is calculated by taking the total number of students and subtracting white students, international students, and students whose race/ethnicity was unknown. This number is then divided by the total number of students at the school to obtain the racial-ethnic minorities percentage.
References
More about our data sources and methodologies.