Explore the best ranked schools for the programs you are most interested in.
Johnson College landed the #1,303 spot in College Factual's 2025 ranking of best overall colleges in the United States. The higher ed experts analyzed 2,152 colleges and universities across the nation to determine this ranking.
Johnson College also holds the #75 spot on the Best Colleges in Pennsylvania ranking.
With an acceptance rate of 96%, Johnson College is easier to get into than many other schools. But that doesn't mean you can slack off on your application. Make sure to treat this school like any other when submitting requested materials and documents.
At Johnson College, the student to faculty ratio is an excellent 8 to 1. That's much better than the national average of 15 to 1. This indicates that many classes will probably be small, and students will have ample opportunites to work closely with their professors and classmates.
When estimating how much access students will have to their teachers, some people like to look at what percentage of faculty members are full time. This is because part-time teachers may not have as much time to spend on campus as their full-time counterparts.
The full-time faculty percentage at Johnson College is 40%. This is lower than the national average of 47%.
Johnson College has a freshmen retention rate of 74%. That's a good sign that full-time students like the school and their professors enough to want to stick around for another year. It's also a sign that the admissions team did a good job in choosing applicants who were a good fit for the school.
During the 2017-2018 academic year, there were 497 undergraduates at Johnson College with 416 being full-time and 81 being part-time.
| $0-30 K | $30K-48K | $48-75 | $75-110K | $110K + |
|---|---|---|---|---|
| $15,514 | $16,883 | $20,320 | $23,397 | $25,668 |
The net price is calculated by adding tuition, room, board and other costs and subtracting financial aid.Note that the net price is typically less than the published for a school. For more information on the sticker price of Johnson College, see our tuition and fees and room and board pages.
While almost two-thirds of students nationwide take out loans to pay for college, the percentage may be quite different for the school you plan on attending. At Johnson College, approximately 54% of students took out student loans averaging $8,551 a year. That adds up to $34,204 over four years for those students.
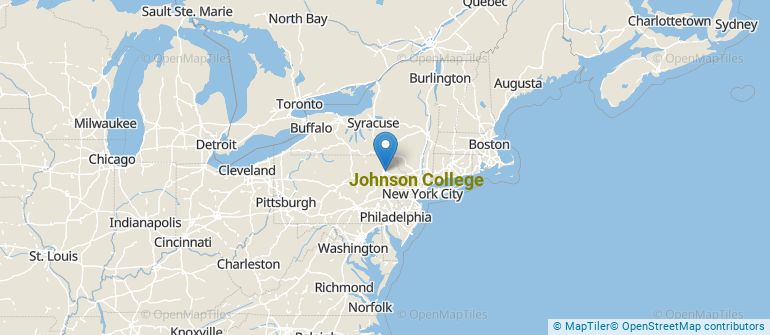
Get more details about the location of Johnson College.
Contact details for Johnson College are given below.
| Contact Details | |
|---|---|
| Address: | 3427 N Main Ave, Scranton, PA 18508-1495 |
| Phone: | 570-342-6404 |
| Website: | www.johnson.edu/ |
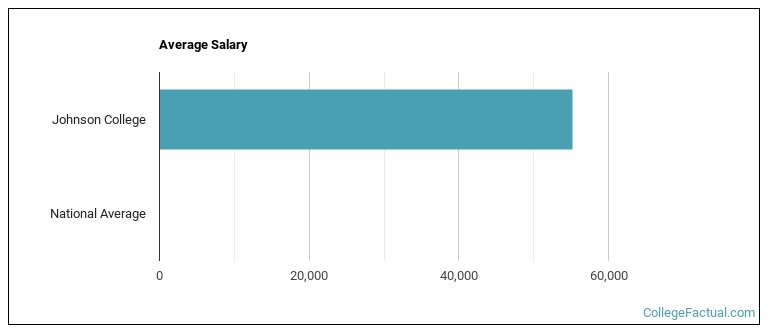
| Most Popular Majors | Bachelor’s Degrees | Average Salary of Graduates |
|---|---|---|
| Electrical & Power Transmission Installers | 41 | NA |
| Heating, Air Conditioning, Ventilation & Refrigeration | 18 | NA |
| Vehicle Maintenance & Repair | 17 | NA |
| Veterinary/Animal Health Technologies/Technicians | 15 | NA |
| Computer Systems Networking | 14 | NA |
| Precision Metal Working | 14 | NA |
| Allied Health Professions | 13 | NA |
| Allied Health & Medical Assisting Services | 10 | NA |
| Carpentry | 8 | NA |
| Electromechanical Engineering Technology | 8 | NA |
Online courses area a great option for busy, working students as well as for those who have scheduling conflicts and want to study on their own time. As time goes by, expect to see more and more online learning options become available.
In 2022-2023, 560 students took at least one online class at Johnson College. This is an increase from the 447 students who took online classes the previous year.
| Year | Took at Least One Online Class | Took All Classes Online |
|---|---|---|
| 2022-2023 | 560 | 0 |
| 2021-2022 | 447 | 14 |
| 2020-2021 | 497 | 25 |
| 2018-2019 | 46 | 0 |
Footnotes
*The racial-ethnic minorities count is calculated by taking the total number of students and subtracting white students, international students, and students whose race/ethnicity was unknown. This number is then divided by the total number of students at the school to obtain the racial-ethnic minorities percentage.
References
More about our data sources and methodologies.