Explore the best ranked schools for the programs you are most interested in.
According to College Factual's 2025 analysis, Judson is ranked #966 out of 2,152 schools in the nation that were analyzed for overall quality.
Out of the 85 colleges in Illinois, Judson is ranked at #38.
The acceptance rate at Judson University is a competitive 58%, so make sure you take your application seriously when putting it together. Even leaving out a minor detail could be a reason to move you to the rejection pile.
About 46% of students accepted to Judson submitted their SAT scores. When looking at the 25th through the 75th percentile, SAT Evidence-Based Reading and Writing scores ranged between 460 and 580. Math scores were between 450 and 560.
The student to faculty ratio is often used to measure the number of teaching resources that a college or university offers its students. The national average for this metric is 15 to 1, but at Judson it is much better at 10 to 1. That's good news for students who want to interact more on a personal level with their teachers.
When estimating how much access students will have to their teachers, some people like to look at what percentage of faculty members are full time. This is because part-time teachers may not have as much time to spend on campus as their full-time counterparts.
The full-time faculty percentage at Judson University is 30%. This is lower than the national average of 47%.
The freshmen retention rate is a sign of how many full-time students like a college or university well enough to come back for their sophomore year. At Judson University this rate is 61%, which is a bit lower than the national average of 68%.
Students are considered to have graduated on time if they finish their studies within four years. At Judson the on-time graduation rate of first-time, full-time students is 53%. That is great when compared to the national average of 33.3%
Find out more about the retention and graduation rates at Judson University.
During the 2017-2018 academic year, there were 954 undergraduates at Judson with 856 being full-time and 98 being part-time.
| $0-30 K | $30K-48K | $48-75 | $75-110K | $110K + |
|---|---|---|---|---|
| $16,882 | $12,341 | $14,470 | $12,848 | $17,697 |
The net price is calculated by adding tuition, room, board and other costs and subtracting financial aid.Note that the net price is typically less than the published for a school. For more information on the sticker price of Judson, see our tuition and fees and room and board pages.
While almost two-thirds of students nationwide take out loans to pay for college, the percentage may be quite different for the school you plan on attending. At Judson, approximately 65% of students took out student loans averaging $9,594 a year. That adds up to $38,376 over four years for those students.
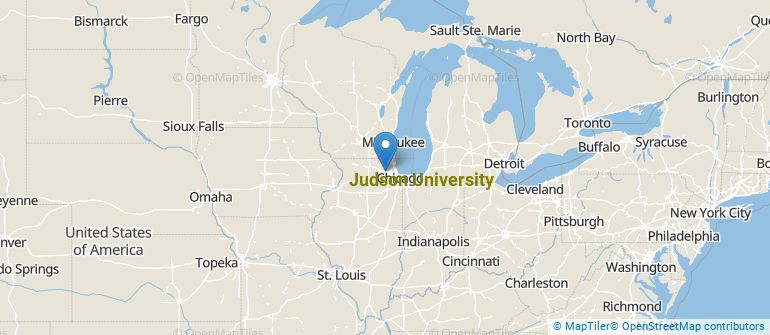
Get more details about the location of Judson University.
Contact details for Judson are given below.
| Contact Details | |
|---|---|
| Address: | 1151 N State St, Elgin, IL 60123-1498 |
| Phone: | 847-628-2500 |
| Website: | www.judsonu.edu/ |
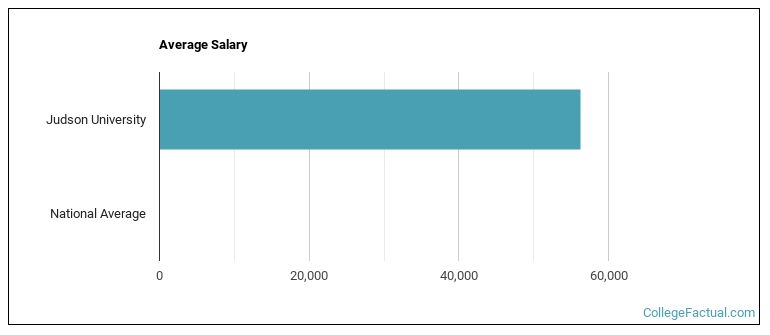
| Most Popular Majors | Bachelor’s Degrees | Average Salary of Graduates |
|---|---|---|
| Business Administration & Management | 106 | $45,731 |
| General Architecture | 32 | $41,033 |
| General Psychology | 31 | $34,964 |
| Clinical, Counseling & Applied Psychology | 25 | NA |
| Marketing | 18 | NA |
| Teacher Education Subject Specific | 17 | NA |
| Health & Physical Education | 16 | NA |
| Liberal Arts General Studies | 14 | NA |
| Human Services | 13 | $37,671 |
| Teacher Education Grade Specific | 12 | NA |
Online courses area a great option for busy, working students as well as for those who have scheduling conflicts and want to study on their own time. As time goes by, expect to see more and more online learning options become available.
In 2022-2023, 573 students took at least one online class at Judson University. This is a decrease from the 755 students who took online classes the previous year.
| Year | Took at Least One Online Class | Took All Classes Online |
|---|---|---|
| 2022-2023 | 573 | 131 |
| 2021-2022 | 755 | 266 |
| 2020-2021 | 861 | 85 |
| 2018-2019 | 443 | 112 |
Footnotes
*The racial-ethnic minorities count is calculated by taking the total number of students and subtracting white students, international students, and students whose race/ethnicity was unknown. This number is then divided by the total number of students at the school to obtain the racial-ethnic minorities percentage.
References
More about our data sources and methodologies.