In its yearly rankings, College Factual analyzes over 2,000 colleges and universities to determine which ones are the best in a variety of categories, such as overall value, quality, diversity, which schools are the best for each major, and much more.
Keene State College was awarded 21 badges in the 2025 rankings. The highest ranked major at the school is engineering technologies.
Explore the best ranked schools for the programs you are most interested in.
Keene State is ranked #905 out of 2,152 schools in the nation for overall quality on College Factual's 2025 Best Colleges list.
Out of the 17 colleges in New Hampshire, Keene State is ranked at #8.
With an acceptance rate of 90%, Keene State College is easier to get into than many other schools. But that doesn't mean you can slack off on your application. Make sure to treat this school like any other when submitting requested materials and documents.
The student to faculty ratio at Keene State College is about average at 15 to 1. This ratio is often used to gauge how many students might be in an average class and how much time professors will have to spend with their students on an individual level. The national average for this metric is 15 to 1.
When estimating how much access students will have to their teachers, some people like to look at what percentage of faculty members are full time. This is because part-time teachers may not have as much time to spend on campus as their full-time counterparts.
The full-time faculty percentage at Keene State College is 41%. This is lower than the national average of 47%.
The freshmen retention rate of 77% tells us that most first-year, full-time students like Keene State College enough to come back for another year. This is a fair bit higher than the national average of 68%. That's certainly something to check off in the good column about the school.
The on-time graduation rate for someone pursuing a bachelor's degree is typically four years. This rate at Keene State for first-time, full-time students is 53%, which is better than the national average of 33.3%.
Find out more about the retention and graduation rates at Keene State College.
During the 2017-2018 academic year, there were 3,096 undergraduates at Keene State with 2,982 being full-time and 114 being part-time.
| $0-30 K | $30K-48K | $48-75 | $75-110K | $110K + |
|---|---|---|---|---|
| $13,113 | $12,800 | $16,047 | $19,242 | $22,914 |
The net price is calculated by adding tuition, room, board and other costs and subtracting financial aid.Note that the net price is typically less than the published for a school. For more information on the sticker price of Keene State, see our tuition and fees and room and board pages.
While almost two-thirds of students nationwide take out loans to pay for college, the percentage may be quite different for the school you plan on attending. At Keene State, approximately 69% of students took out student loans averaging $9,390 a year. That adds up to $37,560 over four years for those students.
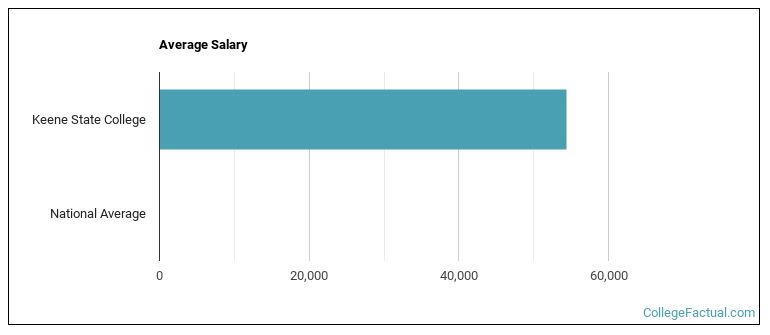
See which majors at Keene State College make the most money.
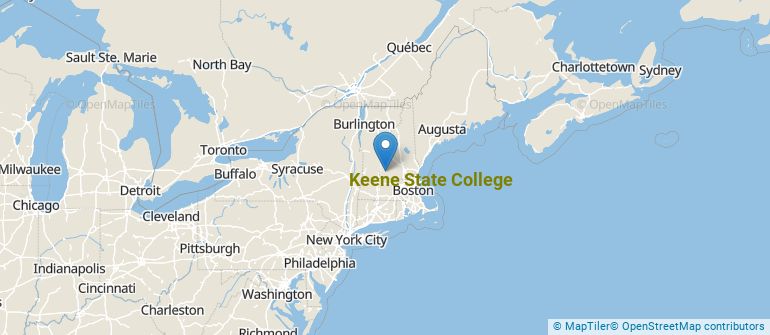
Get more details about the location of Keene State College.
Contact details for Keene State are given below.
| Contact Details | |
|---|---|
| Address: | 229 Main Street, Keene, NH 03435-1506 |
| Phone: | 603-352-1909 |
| Website: | www.keene.edu/ |
| Most Popular Majors | Bachelor’s Degrees | Average Salary of Graduates |
|---|---|---|
| Quality Control Technology | 85 | $63,479 |
| General Psychology | 66 | $34,633 |
| Business Administration & Management | 61 | $47,847 |
| Teacher Education Grade Specific | 57 | $41,564 |
| Criminal Justice & Corrections | 44 | $42,053 |
| Sociology | 40 | $36,581 |
| General Architecture | 38 | $43,448 |
| Communication & Media Studies | 30 | $34,372 |
| General English Literature | 29 | $39,122 |
| Film, Video & Photographic Arts | 28 | $27,261 |
Online courses area a great option for busy, working students as well as for those who have scheduling conflicts and want to study on their own time. As time goes by, expect to see more and more online learning options become available.
In 2022-2023, 164 students took at least one online class at Keene State College. This is a decrease from the 331 students who took online classes the previous year.
| Year | Took at Least One Online Class | Took All Classes Online |
|---|---|---|
| 2022-2023 | 164 | 49 |
| 2021-2022 | 331 | 54 |
| 2020-2021 | 1,927 | 143 |
| 2018-2019 | 37 | 20 |
If you’re considering Keene State College, here are some more schools you may be interested in knowing more about.
Curious on how these schools stack up against Keene State? Pit them head to head with College Combat, our free interactive tool that lets you compare college on the features that matter most to you!
Footnotes
*The racial-ethnic minorities count is calculated by taking the total number of students and subtracting white students, international students, and students whose race/ethnicity was unknown. This number is then divided by the total number of students at the school to obtain the racial-ethnic minorities percentage.
References
More about our data sources and methodologies.