Kellogg Community College total enrollment is approximately 3,469 students.
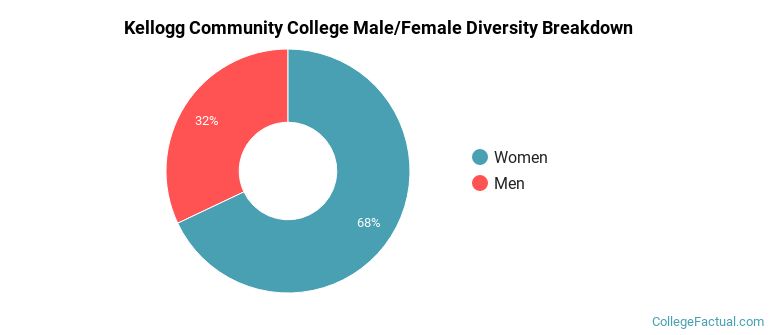
Male/Female Breakdown of Undergraduates
The full-time Kellogg Community College undergraduate population is made up of 63% women, and 37% men.
For the gender breakdown for all students, go here.
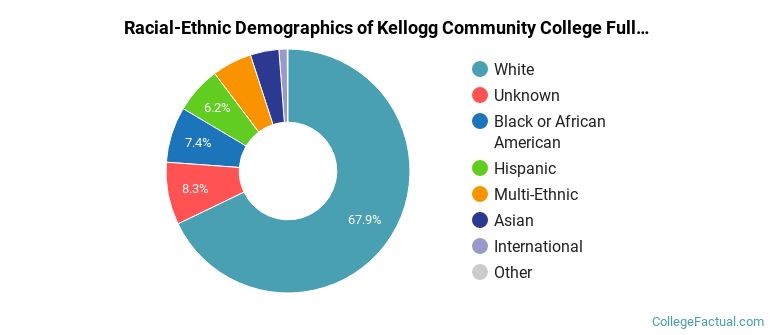
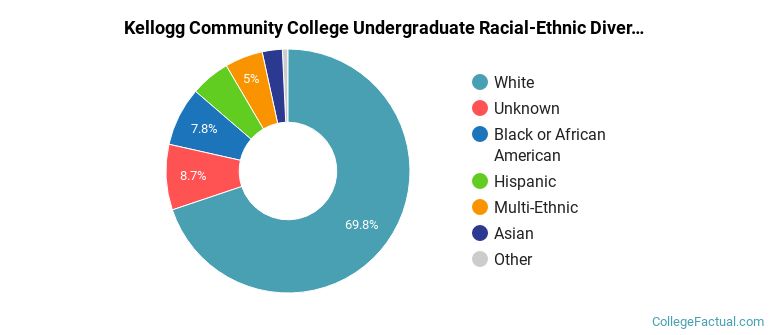
Kellogg Community College Racial/Ethnic Breakdown of Undergraduates
| Race/Ethnicity | Number |
|---|---|
| White | 621 |
| Unknown | 68 |
| Black or African American | 65 |
| Hispanic | 58 |
| Multi-Ethnic | 45 |
| Asian | 24 |
| International | 6 |
| Native Hawaiian or Pacific Islander | 0 |
See racial/ethnic breakdown for all students.
| Race/Ethnicity | Number |
|---|---|
| White | 2,516 |
| Unknown | 258 |
| Black or African American | 232 |
| Hispanic | 179 |
| Multi-Ethnic | 167 |
| Asian | 72 |
| International | 19 |
| Native Hawaiian or Pacific Islander | 3 |
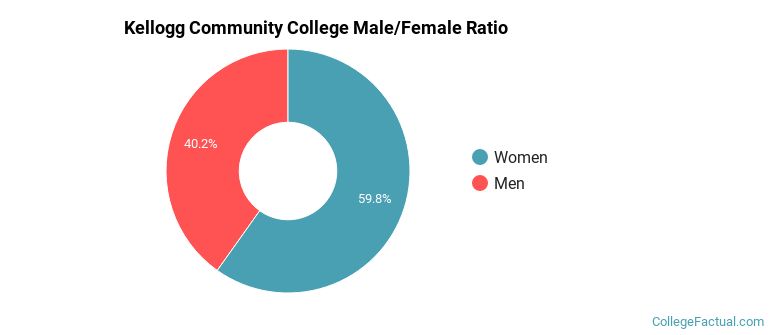
There are approximately 2,378 female students and 1,091 male students at Kellogg Community College.
Students from 6 countries are represented at this school, with the majority of the international students coming from Myanmar/Burma, India, and United Kingdom.
Learn more about international students at Kellogg Community College.
A traditional college student is defined as being between the ages of 18-21. At Kellogg Community College, 34.69% of students fall into that category, compared to the national average of 60%.
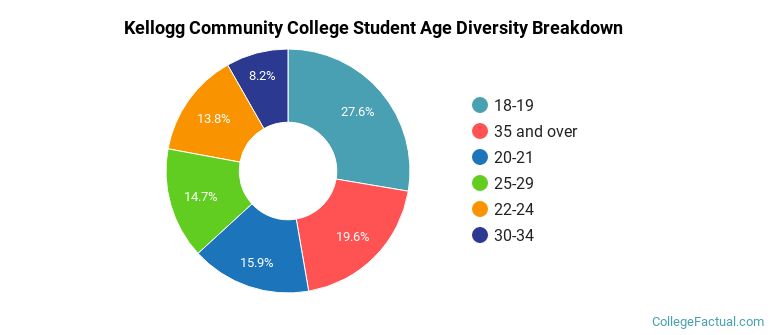
| Student Age Group | Amount |
|---|---|
| 18-19 | 1,060 |
| 35 and over | 753 |
| 20-21 | 610 |
| 25-29 | 564 |
| 22-24 | 531 |
| 30-34 | 316 |
| Under 18 | 0 |
Footnotes
*The racial-ethnic minorities count is calculated by taking the total number of students and subtracting white students, international students, and students whose race/ethnicity was unknown. This number is then divided by the total number of students at the school to obtain the racial-ethnic minorities percentage.
References