College Factual recognizes the best colleges and universities in its annual rankings. These rankings include categories for best overall colleges, best colleges for each major, best value schools, and much more.
Kettering College was awarded 7 badges in the 2025 rankings. The highest ranked major at the school is allied health professions.
Explore the best ranked schools for the programs you are most interested in.
Kettering College was not ranked in College Factual's 2025 Best Overall Colleges report. This could be for a number of reasons, including lack of data.
If you're applying to Kettering College you'll face some tough competition, since the school's acceptance rate is only 34%. Definitely don't wait until the last minute to submit your application, since applying early may be in your favor.
Kettering College received ACT scores from 57% of accepted students. When looking at the 25th through the 75th percentile, ACT Composite scores ranged between 18 and 23.
At Kettering College, the student to faculty ratio is an excellent 8 to 1. That's much better than the national average of 15 to 1. This indicates that many classes will probably be small, and students will have ample opportunites to work closely with their professors and classmates.
In addition to the student to faculty ratio, some people look at what percentage of faculty members are full-time as a sign of how much time professors will be able to spend with their students. This is because part-time teachers may not be be on campus as much as their full-time counterparts.
The full-time faculty percentage at Kettering College is 83%. This is higher than the national average of 47%.
Kettering College has a freshmen retention rate of 73%. That's a good sign that full-time students like the school and their professors enough to want to stick around for another year. It's also a sign that the admissions team did a good job in choosing applicants who were a good fit for the school.
When it comes to finishing their studies on time, those seeking a bachelor's degree from Kettering College have a four-year graduation rate of 31%. This is comparable to the national average of 33.3%
Find out more about the retention and graduation rates at Kettering College.
During the 2017-2018 academic year, there were 566 undergraduates at Kettering College with 356 being full-time and 210 being part-time.
| $0-30 K | $30K-48K | $48-75 | $75-110K | $110K + |
|---|---|---|---|---|
| $9,509 | $11,196 | $19,572 | $20,605 | $19,305 |
The net price is calculated by adding tuition, room, board and other costs and subtracting financial aid.Note that the net price is typically less than the published for a school. For more information on the sticker price of Kettering College, see our tuition and fees and room and board pages.
Almost 66% of college students who graduated with the class of 2018 took out student loans, but that percentage varies from school to school. At Kettering College, approximately 52% of students took out student loans averaging $8,098 a year. That adds up to $32,392 over four years for those students.
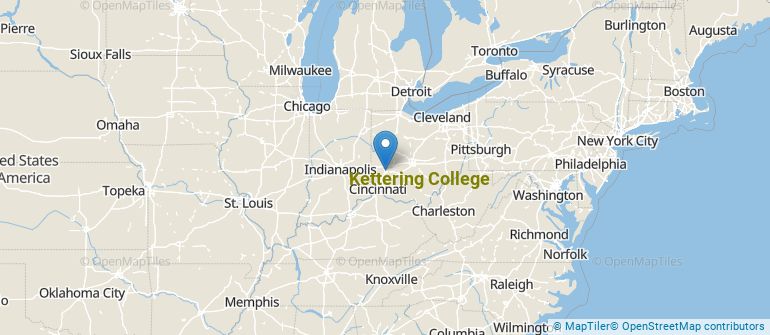
Get more details about the location of Kettering College.
Contact details for Kettering College are given below.
| Contact Details | |
|---|---|
| Address: | 3737 Southern Blvd, Kettering, OH 45429-1299 |
| Phone: | 937-395-8601 |
| Website: | kc.edu/ |
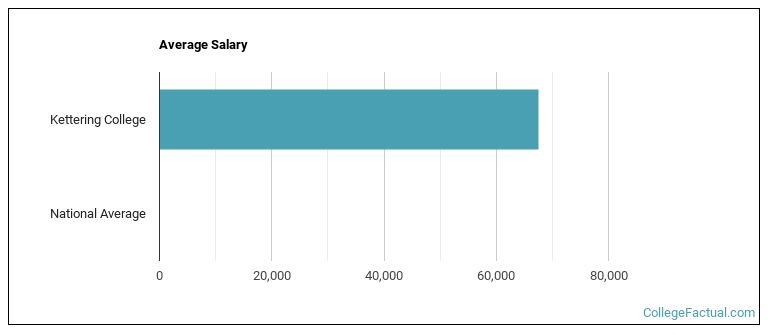
| Most Popular Majors | Bachelor’s Degrees | Average Salary of Graduates |
|---|---|---|
| Nursing | 110 | $79,505 |
| Allied Health Professions | 105 | $65,690 |
| Rehabilitation & Therapeutic Professions | 27 | NA |
| Other Health Professions | 10 | $70,890 |
| Allied Health & Medical Assisting Services | 6 | NA |
| Health/Medical Prep Programs | 6 | NA |
Online learning options are becoming more and more popular at American colleges and universities. Online classes are great for students who have busy schedules or for those who just want to study on their own time.
In 2022-2023, 345 students took at least one online class at Kettering College. This is an increase from the 321 students who took online classes the previous year.
| Year | Took at Least One Online Class | Took All Classes Online |
|---|---|---|
| 2022-2023 | 345 | 96 |
| 2021-2022 | 321 | 63 |
| 2020-2021 | 736 | 428 |
| 2018-2019 | 306 | 143 |
Footnotes
*The racial-ethnic minorities count is calculated by taking the total number of students and subtracting white students, international students, and students whose race/ethnicity was unknown. This number is then divided by the total number of students at the school to obtain the racial-ethnic minorities percentage.
References
More about our data sources and methodologies.