Explore the best ranked schools for the programs you are most interested in.
College Factual ranked Millsaps as #1,695 out of 2,152 colleges and universities in the country on its 2025 Best Colleges list.
Millsaps College has an acceptance rate of 68%, which means the school is serious about who it admits. Take your time in putting together a strong application that highlights why you are a good fit for Millsaps.
About 4% of students accepted to Millsaps submitted their SAT scores. When looking at the 25th through the 75th percentile, SAT Evidence-Based Reading and Writing scores ranged between 610 and 699. Math scores were between 525 and 655.
The student to faculty ratio at Millsaps is an impressive 9 to 1. That's quite good when you compare it to the national average of 15 to 1. This is a good sign that students at the school will have more opportunities for one-on-one interactions with their professors.
When estimating how much access students will have to their teachers, some people like to look at what percentage of faculty members are full time. This is because part-time teachers may not have as much time to spend on campus as their full-time counterparts.
The full-time faculty percentage at Millsaps College is 76%. This is higher than the national average of 47%.
Millsaps College has a freshmen retention rate of 83%. That's a good sign that full-time students like the school and their professors enough to want to stick around for another year. It's also a sign that the admissions team did a good job in choosing applicants who were a good fit for the school.
The on-time graduation rate for someone pursuing a bachelor's degree is typically four years. This rate at Millsaps for first-time, full-time students is 66%, which is better than the national average of 33.3%.
Find out more about the retention and graduation rates at Millsaps College.
During the 2017-2018 academic year, there were 669 undergraduates at Millsaps with 660 being full-time and 9 being part-time.
| $0-30 K | $30K-48K | $48-75 | $75-110K | $110K + |
|---|---|---|---|---|
| $23,228 | $26,616 | $26,664 | $29,061 | $29,275 |
The net price is calculated by adding tuition, room, board and other costs and subtracting financial aid.Note that the net price is typically less than the published for a school. For more information on the sticker price of Millsaps, see our tuition and fees and room and board pages.
While almost two-thirds of students nationwide take out loans to pay for college, the percentage may be quite different for the school you plan on attending. At Millsaps, approximately 77% of students took out student loans averaging $6,511 a year. That adds up to $26,044 over four years for those students.
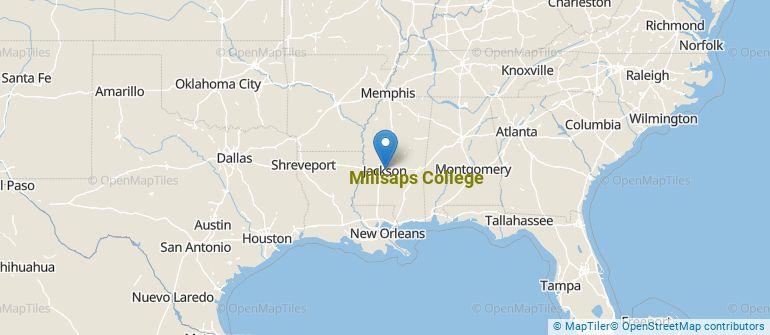
Get more details about the location of Millsaps College.
Contact details for Millsaps are given below.
| Contact Details | |
|---|---|
| Address: | 1701 N State St, Jackson, MS 39210-0001 |
| Phone: | 601-974-1000 |
| Website: | www.millsaps.edu/ |
| Most Popular Majors | Bachelor’s Degrees | Average Salary of Graduates |
|---|---|---|
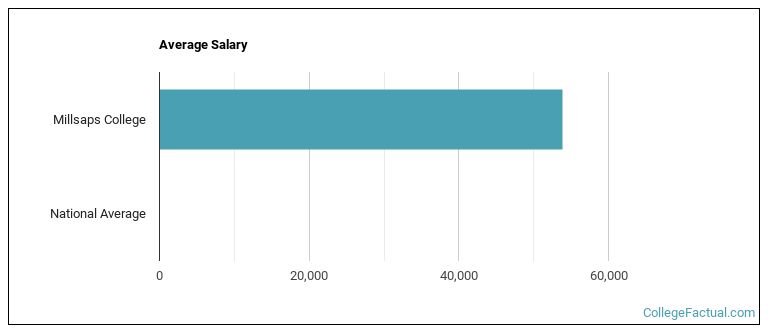
| Business Administration & Management | 54 | $39,765 |
| General Biology | 32 | NA |
| General Psychology | 16 | NA |
| Accounting | 14 | NA |
| Sociology | 10 | NA |
| Biochemistry, Biophysics & Molecular Biology | 9 | NA |
| Neurobiology & Neurosciences | 9 | NA |
| Writing Studies | 9 | NA |
| Political Science & Government | 7 | NA |
| General Visual & Performing Arts | 7 | NA |
Online courses area a great option for busy, working students as well as for those who have scheduling conflicts and want to study on their own time. As time goes by, expect to see more and more online learning options become available.
In 2022-2023, 49 students took at least one online class at Millsaps College. This is an increase from the 24 students who took online classes the previous year.
| Year | Took at Least One Online Class | Took All Classes Online |
|---|---|---|
| 2022-2023 | 49 | 0 |
| 2021-2022 | 24 | 0 |
| 2020-2021 | 503 | 1 |
| 2018-2019 | 0 | 0 |
If you’re considering Millsaps College, here are some more schools you may be interested in knowing more about.
Curious on how these schools stack up against Millsaps? Pit them head to head with College Combat, our free interactive tool that lets you compare college on the features that matter most to you!
Footnotes
*The racial-ethnic minorities count is calculated by taking the total number of students and subtracting white students, international students, and students whose race/ethnicity was unknown. This number is then divided by the total number of students at the school to obtain the racial-ethnic minorities percentage.
References
More about our data sources and methodologies.