MSU total enrollment is approximately 2,920 students. 1,836 are undergraduates and 112 are graduate students.
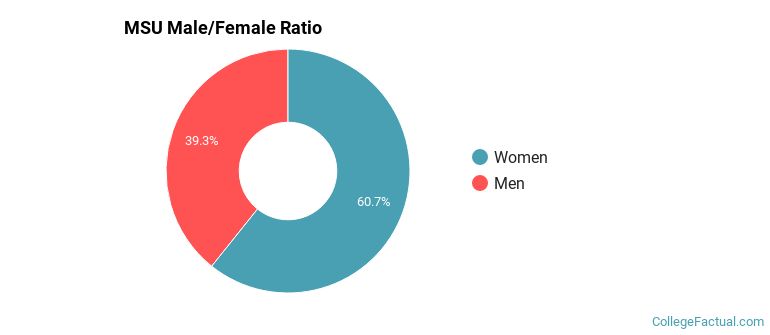
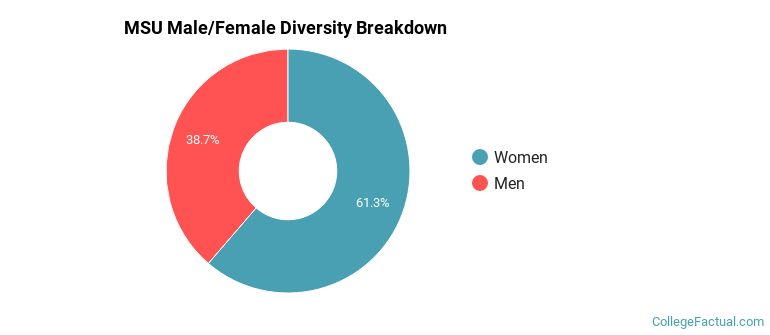
Male/Female Breakdown of Undergraduates
The full-time MSU undergraduate population is made up of 62% women, and 38% men.
For the gender breakdown for all students, go here.
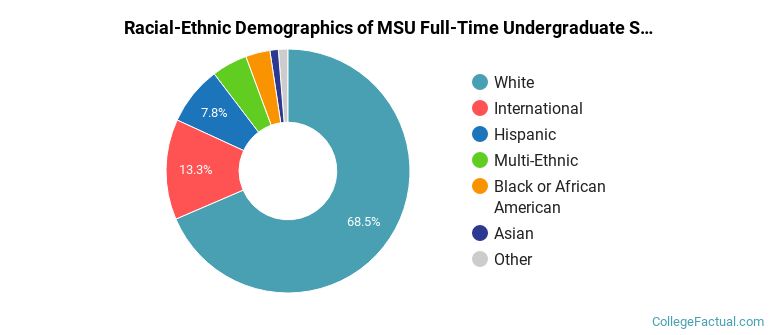
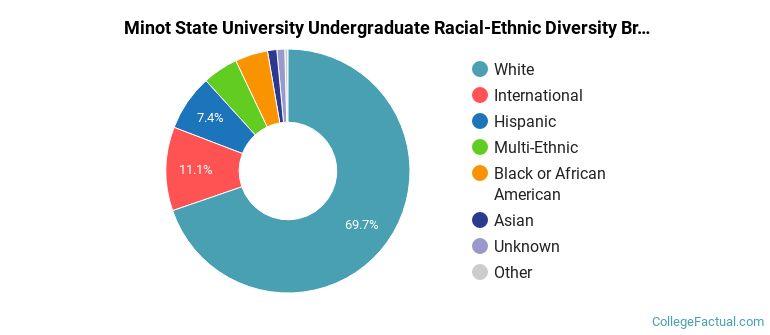
MSU Racial/Ethnic Breakdown of Undergraduates
| Race/Ethnicity | Number |
|---|---|
| White | 1,231 |
| International | 225 |
| Hispanic | 151 |
| Multi-Ethnic | 102 |
| Black or African American | 54 |
| Asian | 27 |
| Unknown | 10 |
| Native Hawaiian or Pacific Islander | 8 |
See racial/ethnic breakdown for all students.
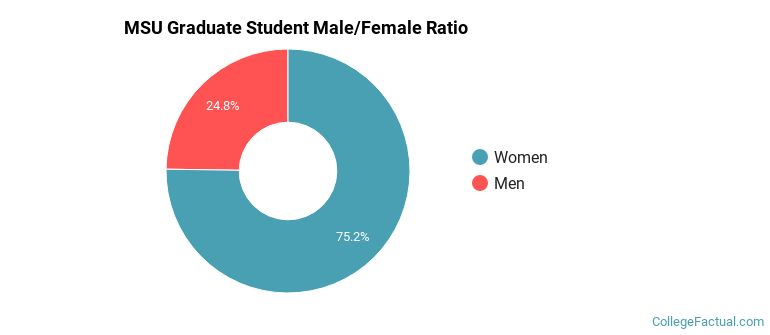
Male/Female Breakdown of Graduate Students
About 74% of full-time grad students are women, and 26% men.
For the gender breakdown for all students, go here.
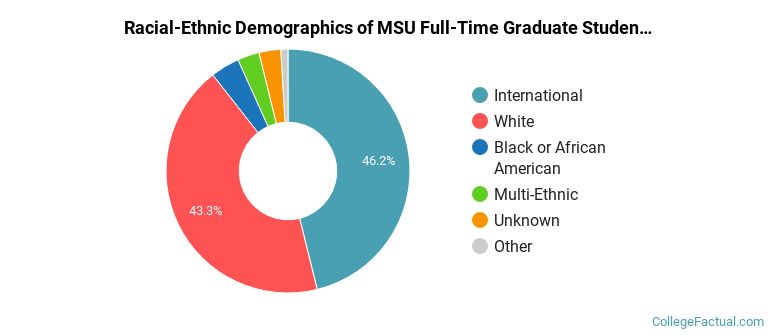
MSU Racial-Ethnic Breakdown of Graduate Students
| Race/Ethnicity | Number |
|---|---|
| White | 46 |
| International | 44 |
| Hispanic | 7 |
| Black or African American | 4 |
| Unknown | 4 |
| Asian | 3 |
| Native Hawaiian or Pacific Islander | 0 |
| Multi-Ethnic | 0 |
See racial/ethnic breakdown for all students.
| Race/Ethnicity | Number |
|---|---|
| White | 1,995 |
| International | 307 |
| Hispanic | 221 |
| Multi-Ethnic | 149 |
| Black or African American | 111 |
| Asian | 43 |
| Unknown | 25 |
| Native Hawaiian or Pacific Islander | 12 |
There are approximately 1,834 female students and 1,086 male students at MSU.
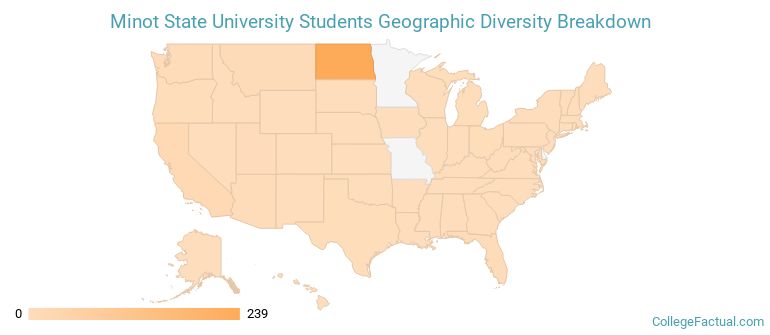
MSU ranks 642 out of 2,183 when it comes to geographic diversity.
24.61% of MSU students come from out of state, and 11.2% come from out of the country.
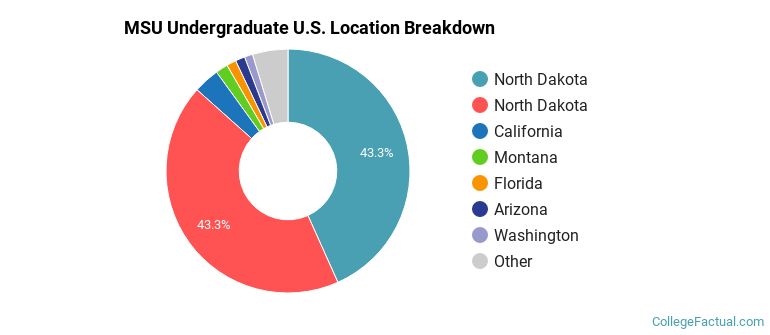
The undergraduate student body is split among 27 states (may include Washington D.C.). Click on the map for more detail.
| State | Amount |
|---|---|
| North Dakota | 239 |
| North Dakota | 239 |
| California | 19 |
| Montana | 9 |
| Arizona | 7 |
Students from 58 countries are represented at this school, with the majority of the international students coming from Canada, Nigeria, and South Korea.
Learn more about international students at MSU.
A traditional college student is defined as being between the ages of 18-21. At MSU, 44.43% of students fall into that category, compared to the national average of 60%.
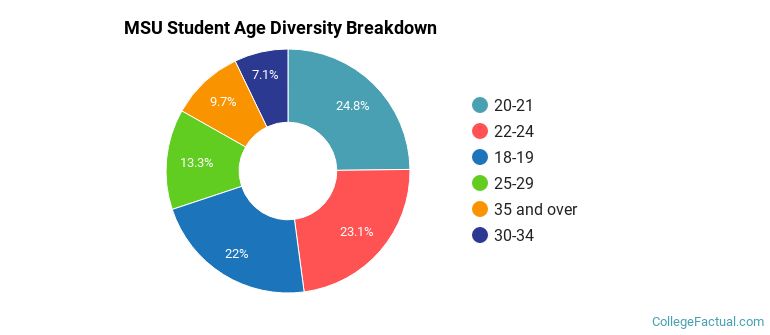
| Student Age Group | Amount |
|---|---|
| 20-21 | 757 |
| 22-24 | 705 |
| 18-19 | 672 |
| 25-29 | 406 |
| 35 and over | 295 |
| 30-34 | 218 |
| Under 18 | 0 |
Footnotes
*The racial-ethnic minorities count is calculated by taking the total number of students and subtracting white students, international students, and students whose race/ethnicity was unknown. This number is then divided by the total number of students at the school to obtain the racial-ethnic minorities percentage.
References