
College Factual analyzes over 2,000 colleges and universities in its annual rankings and ranks them in a variety of ways, including most diverse, best overall quality, best for non-traditional students, and much more.
Mott Community College was awarded 5 badges in the 2025 rankings. The highest ranked major at the school is liberal arts general studies.
Explore the best ranked schools for the programs you are most interested in.
College Factual ranked MCC as #1,220 out of 2,152 colleges and universities in the country on its 2025 Best Colleges list. This is an improvement over the previous year, when MCC held the #1,475 spot on the Best Overall Colleges list.
MCC is also ranked #31 out of 56 schools in Michigan.
Mott Community College has an open admissions policy, so you should not have much trouble being accepted by the school. Still, it is important to fill out the application completely and submit any requested materials, which may include proof that you have a high school diploma or the equivalent.
The student to faculty ratio is often used to estimate how much interaction there is between professors and their students at a college or university. At Mott Community College, this ratio is 17 to 1, which is on par with the national average of 15 to 1. That's not bad at all.
Another measure that is often used to estimate how much access students will have to their professors is how many faculty members are full-time. The idea here is that part-time faculty tend to spend less time on campus, so they may not be as available to students as full-timers.
The full-time faculty percentage at Mott Community College is 100%. This is higher than the national average of 47%.
The freshmen retention rate is a sign of how many full-time students like a college or university well enough to come back for their sophomore year. At Mott Community College this rate is 61%, which is a bit lower than the national average of 68%.
During the 2017-2018 academic year, there were 5,920 undergraduates at MCC with 1,765 being full-time and 4,155 being part-time.
| $0-30 K | $30K-48K | $48-75 | $75-110K | $110K + |
|---|---|---|---|---|
| $6,704 | $7,080 | $8,562 | $10,569 | $11,802 |
The net price is calculated by adding tuition, room, board and other costs and subtracting financial aid.Note that the net price is typically less than the published for a school. For more information on the sticker price of MCC, see our tuition and fees and room and board pages.
It's not uncommon for college students to take out loans to pay for school. In fact, almost 66% of students nationwide depend at least partially on loans. At MCC, approximately 28% of students took out student loans averaging $3,632 a year. That adds up to $14,528 over four years for those students.
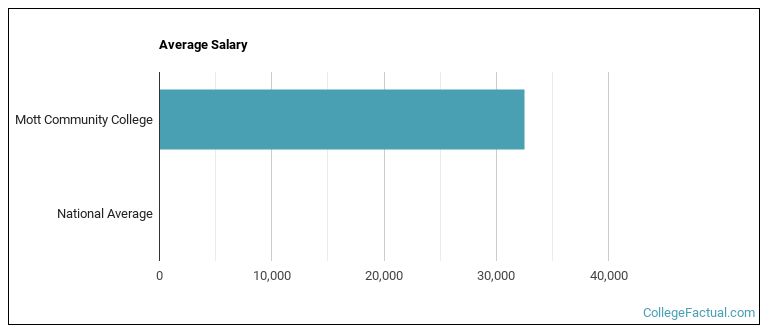
See which majors at Mott Community College make the most money.
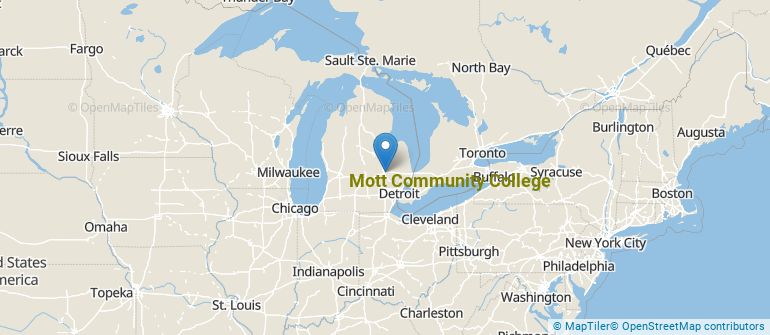
Get more details about the location of Mott Community College.
Contact details for MCC are given below.
| Contact Details | |
|---|---|
| Address: | 1401 E Court St, Flint, MI 48503-2089 |
| Phone: | 810-762-0200 |
| Website: | https://www.mcc.edu/ |
| Most Popular Majors | Bachelor’s Degrees | Average Salary of Graduates |
|---|---|---|
| Liberal Arts General Studies | 466 | NA |
| Nursing | 135 | NA |
| General Biology | 77 | NA |
| Business Administration & Management | 63 | NA |
| Cosmetology | 44 | NA |
| Allied Health & Medical Assisting Services | 37 | NA |
| Computer Programming | 28 | NA |
| Criminal Justice & Corrections | 27 | NA |
| General Business/Commerce | 25 | NA |
| Accounting | 19 | NA |
Online learning is becoming popular at even the oldest colleges and universities in the United States. Not only are online classes great for returning adults with busy schedules, they are also frequented by a growing number of traditional students.
In 2022-2023, 4,781 students took at least one online class at Mott Community College. This is a decrease from the 4,988 students who took online classes the previous year.
| Year | Took at Least One Online Class | Took All Classes Online |
|---|---|---|
| 2022-2023 | 4,781 | 2,959 |
| 2021-2022 | 4,988 | 3,206 |
| 2020-2021 | 5,686 | 4,885 |
| 2018-2019 | 1,242 | 521 |
Footnotes
*The racial-ethnic minorities count is calculated by taking the total number of students and subtracting white students, international students, and students whose race/ethnicity was unknown. This number is then divided by the total number of students at the school to obtain the racial-ethnic minorities percentage.
References
More about our data sources and methodologies.