Explore the best ranked schools for the programs you are most interested in.
College Factual ranked Mt. Holyoke as #670 out of 2,152 colleges and universities in the country on its 2025 Best Colleges list.
Mt. Holyoke also holds the #36 spot on the Best Colleges in Massachusetts ranking.
Mount Holyoke College has an acceptance rate of 40%, which means the school is serious about who it admits. Take your time in putting together a strong application that highlights why you are a good fit for Mt. Holyoke.
About 19% of students accepted to Mt. Holyoke submitted their SAT scores. When looking at the 25th through the 75th percentile, SAT Evidence-Based Reading and Writing scores ranged between 690 and 770. Math scores were between 660 and 770.
At Mt. Holyoke, the student to faculty ratio is an excellent 9 to 1. That's much better than the national average of 15 to 1. This indicates that many classes will probably be small, and students will have ample opportunites to work closely with their professors and classmates.
Another measure that is often used to estimate how much access students will have to their professors is how many faculty members are full-time. The idea here is that part-time faculty tend to spend less time on campus, so they may not be as available to students as full-timers.
The full-time faculty percentage at Mount Holyoke College is 89%. This is higher than the national average of 47%.
Mount Holyoke College has a freshmen retention rate of 90%. That's a good sign that full-time students like the school and their professors enough to want to stick around for another year. It's also a sign that the admissions team did a good job in choosing applicants who were a good fit for the school.
The on-time graduation rate for someone pursuing a bachelor's degree is typically four years. This rate at Mt. Holyoke for first-time, full-time students is 80%, which is better than the national average of 33.3%.
Find out more about the retention and graduation rates at Mount Holyoke College.
During the 2017-2018 academic year, there were 1,915 undergraduates at Mt. Holyoke with 1,892 being full-time and 23 being part-time.
| $0-30 K | $30K-48K | $48-75 | $75-110K | $110K + |
|---|---|---|---|---|
| $17,822 | $21,476 | $22,975 | $27,914 | $45,825 |
The net price is calculated by adding tuition, room, board and other costs and subtracting financial aid.Note that the net price is typically less than the published for a school. For more information on the sticker price of Mt. Holyoke, see our tuition and fees and room and board pages.
It's not uncommon for college students to take out loans to pay for school. In fact, almost 66% of students nationwide depend at least partially on loans. At Mt. Holyoke, approximately 53% of students took out student loans averaging $6,098 a year. That adds up to $24,392 over four years for those students.
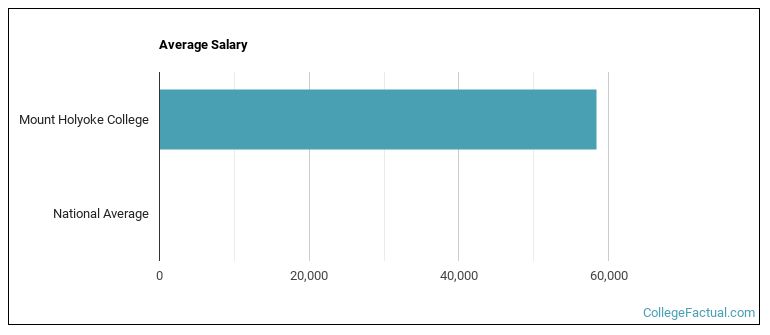
See which majors at Mount Holyoke College make the most money.
Get more details about the location of Mount Holyoke College.
Contact details for Mt. Holyoke are given below.
| Contact Details | |
|---|---|
| Address: | 50 College Street, South Hadley, MA 01075-1489 |
| Phone: | 413-538-2000 |
| Website: | https://www.mtholyoke.edu/ |
| Most Popular Majors | Bachelor’s Degrees | Average Salary of Graduates |
|---|---|---|
| Child Development & Psychology | 83 | $32,439 |
| Political Science & Government | 53 | $48,690 |
| Economics | 50 | NA |
| General Biology | 47 | $39,270 |
| Natural Resources Conservation | 46 | $22,791 |
| Computer Science | 42 | $71,672 |
| Other Education | 38 | NA |
| Sociology | 36 | $40,675 |
| General English Literature | 32 | $22,680 |
| Romance Languages | 30 | $26,013 |
Online learning is becoming popular at even the oldest colleges and universities in the United States. Not only are online classes great for returning adults with busy schedules, they are also frequented by a growing number of traditional students.
In 2022-2023, 174 students took at least one online class at Mount Holyoke College. This is an increase from the 124 students who took online classes the previous year.
| Year | Took at Least One Online Class | Took All Classes Online |
|---|---|---|
| 2022-2023 | 174 | 147 |
| 2021-2022 | 124 | 108 |
| 2020-2021 | 2,040 | 2,033 |
| 2018-2019 | 81 | 71 |
Footnotes
*The racial-ethnic minorities count is calculated by taking the total number of students and subtracting white students, international students, and students whose race/ethnicity was unknown. This number is then divided by the total number of students at the school to obtain the racial-ethnic minorities percentage.
References
More about our data sources and methodologies.