Explore the best ranked schools for the programs you are most interested in.
NEC is ranked #1,530 out of 2,152 schools in the nation for overall quality on College Factual's 2025 Best Colleges list.
NEC is also ranked #13 out of 17 schools in New Hampshire.
New England College has an acceptance rate of 100%, so it is easier to gain admission to this school than some others. Still, the admissions staff will examine your application closely to make sure you're a good fit for NEC.
At NEC, the student to faculty ratio is an excellent 7 to 1. That's much better than the national average of 15 to 1. This indicates that many classes will probably be small, and students will have ample opportunites to work closely with their professors and classmates.
In addition to the student to faculty ratio, some people look at what percentage of faculty members are full-time as a sign of how much time professors will be able to spend with their students. This is because part-time teachers may not be be on campus as much as their full-time counterparts.
The full-time faculty percentage at New England College is 13%. This is lower than the national average of 47%.
The freshmen retention rate is a sign of how many full-time students like a college or university well enough to come back for their sophomore year. At New England College this rate is 61%, which is a bit lower than the national average of 68%.
The on-time graduation rate is the percent of first-time, full time students who obtain their bachelor's degree in four years or less. This rate is 17% for first-time, full-time students at NEC, which is lower than the national rate of 33.3%.
Find out more about the retention and graduation rates at New England College.
During the 2017-2018 academic year, there were 1,774 undergraduates at NEC with 1,644 being full-time and 130 being part-time.
| $0-30 K | $30K-48K | $48-75 | $75-110K | $110K + |
|---|---|---|---|---|
| $24,438 | $29,552 | $29,232 | $31,966 | $32,395 |
The net price is calculated by adding tuition, room, board and other costs and subtracting financial aid.Note that the net price is typically less than the published for a school. For more information on the sticker price of NEC, see our tuition and fees and room and board pages.
Almost 66% of college students who graduated with the class of 2018 took out student loans, but that percentage varies from school to school. At NEC, approximately 76% of students took out student loans averaging $9,028 a year. That adds up to $36,112 over four years for those students.
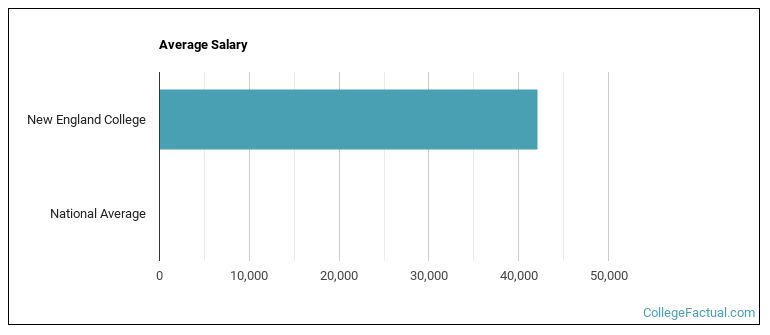
See which majors at New England College make the most money.
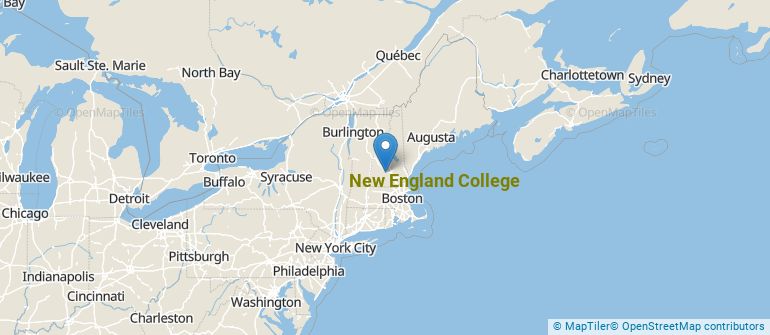
Get more details about the location of New England College.
Contact details for NEC are given below.
| Contact Details | |
|---|---|
| Address: | 98 Bridge St, Henniker, NH 03242 |
| Phone: | 603-428-2000 |
| Website: | www.nec.edu/ |
| Most Popular Majors | Bachelor’s Degrees | Average Salary of Graduates |
|---|---|---|
| Information Technology | 374 | NA |
| Criminal Justice & Corrections | 176 | $45,575 |
| Computer Software & Applications | 113 | NA |
| Business Administration & Management | 78 | $45,086 |
| Computer Information Systems | 53 | NA |
| Educational Administration | 40 | NA |
| International Relations & National Security | 36 | NA |
| Health & Medical Administrative Services | 34 | $50,213 |
| General Psychology | 32 | $42,656 |
| Accounting | 29 | NA |
Online learning options are becoming more and more popular at American colleges and universities. Online classes are great for students who have busy schedules or for those who just want to study on their own time.
In 2022-2023, 919 students took at least one online class at New England College. This is a decrease from the 1,703 students who took online classes the previous year.
| Year | Took at Least One Online Class | Took All Classes Online |
|---|---|---|
| 2022-2023 | 919 | 474 |
| 2021-2022 | 1,703 | 700 |
| 2020-2021 | 4,265 | 844 |
| 2018-2019 | 1,099 | 1,055 |
Footnotes
*The racial-ethnic minorities count is calculated by taking the total number of students and subtracting white students, international students, and students whose race/ethnicity was unknown. This number is then divided by the total number of students at the school to obtain the racial-ethnic minorities percentage.
References
More about our data sources and methodologies.