In its yearly rankings, College Factual analyzes over 2,000 colleges and universities to determine which ones are the best in a variety of categories, such as overall value, quality, diversity, which schools are the best for each major, and much more.
New England Institute of Technology was awarded 11 badges in the 2025 rankings. The highest ranked major at the school is nursing.
Explore the best ranked schools for the programs you are most interested in.
College Factual ranked New England Tech as #677 out of 2,152 colleges and universities in the country on its 2025 Best Colleges list.
New England Tech is also ranked #8 out of 9 schools in Rhode Island.
See all of the rankings for New England Institute of Technology.
The acceptance rate at New England Institute of Technology is 74%. That's higher than the rate at many schools, but still low enough to be considered somewhat selective. If you want to get in, you'll need good grades and to be able to show that New England Tech is a good fit for you.
About 12% of students accepted to New England Tech submitted their SAT scores. When looking at the 25th through the 75th percentile, SAT Evidence-Based Reading and Writing scores ranged between 460 and 580. Math scores were between 460 and 560.
Learn more about New England Institute of Technology admissions.
The student to faculty ratio at New England Tech is an impressive 12 to 1. That's quite good when you compare it to the national average of 15 to 1. This is a good sign that students at the school will have more opportunities for one-on-one interactions with their professors.
When estimating how much access students will have to their teachers, some people like to look at what percentage of faculty members are full time. This is because part-time teachers may not have as much time to spend on campus as their full-time counterparts.
The full-time faculty percentage at New England Institute of Technology is 100%. This is higher than the national average of 47%.
During the 2017-2018 academic year, there were 1,843 undergraduates at New England Tech with 1,579 being full-time and 264 being part-time.
| $0-30 K | $30K-48K | $48-75 | $75-110K | $110K + |
|---|---|---|---|---|
| $30,030 | $32,877 | $35,391 | $39,772 | $42,694 |
The net price is calculated by adding tuition, room, board and other costs and subtracting financial aid.Note that the net price is typically less than the published for a school. For more information on the sticker price of New England Tech, see our tuition and fees and room and board pages.
While almost two-thirds of students nationwide take out loans to pay for college, the percentage may be quite different for the school you plan on attending. At New England Tech, approximately 80% of students took out student loans averaging $9,159 a year. That adds up to $36,636 over four years for those students.
Get more details about paying for New England Institute of Technology.
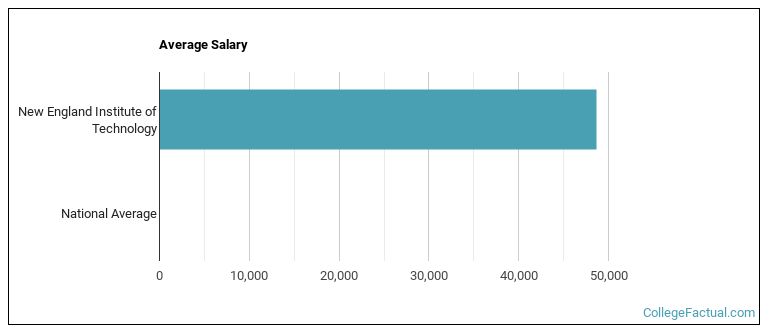
See which majors at New England Institute of Technology make the most money.
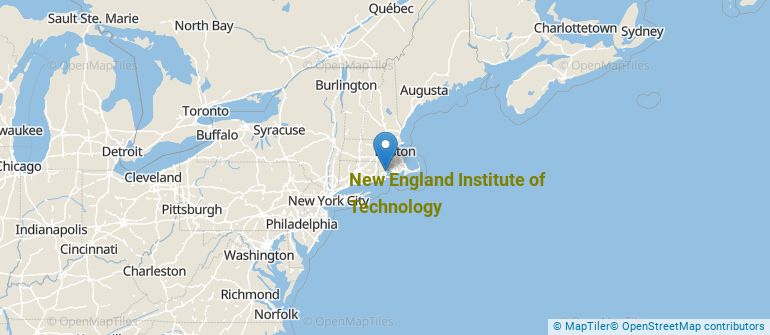
Get more details about the location of New England Institute of Technology.
Contact details for New England Tech are given below.
| Contact Details | |
|---|---|
| Address: | One New England Tech Boulevard, East Greenwich, RI 02818-1205 |
| Phone: | 401-739-5000 |
| Website: | https://www.neit.edu/ |
| Most Popular Majors | Bachelor’s Degrees | Average Salary of Graduates |
|---|---|---|
| Nursing | 145 | $86,470 |
| Vehicle Maintenance & Repair | 67 | NA |
| Design & Applied Arts | 60 | $27,383 |
| Information Technology | 58 | $67,411 |
| Rehabilitation & Therapeutic Professions | 48 | NA |
| Computer Programming | 47 | $72,595 |
| Mechanical Engineering Technology | 42 | $70,916 |
| Architectural Engineering Technology | 41 | $50,342 |
| Allied Health & Medical Assisting Services | 41 | NA |
| Audiovisual Communications | 33 | $37,101 |
Online courses area a great option for busy, working students as well as for those who have scheduling conflicts and want to study on their own time. As time goes by, expect to see more and more online learning options become available.
In 2022-2023, 673 students took at least one online class at New England Institute of Technology. This is a decrease from the 787 students who took online classes the previous year.
| Year | Took at Least One Online Class | Took All Classes Online |
|---|---|---|
| 2022-2023 | 673 | 142 |
| 2021-2022 | 787 | 252 |
| 2020-2021 | 803 | 176 |
| 2018-2019 | 735 | 171 |
Learn more about online learning at New England Institute of Technology.
If you’re considering New England Institute of Technology, here are some more schools you may be interested in knowing more about.
Curious on how these schools stack up against New England Tech? Pit them head to head with College Combat, our free interactive tool that lets you compare college on the features that matter most to you!
Footnotes
*The racial-ethnic minorities count is calculated by taking the total number of students and subtracting white students, international students, and students whose race/ethnicity was unknown. This number is then divided by the total number of students at the school to obtain the racial-ethnic minorities percentage.
References
More about our data sources and methodologies.