College Factual analyzes over 2,000 colleges and universities in its annual rankings and ranks them in a variety of ways, including most diverse, best overall quality, best for non-traditional students, and much more.
Newman University was awarded 8 badges in the 2025 rankings. The highest ranked major at the school is health professions.
Explore the best ranked schools for the programs you are most interested in.
According to College Factual's 2025 analysis, Newman University is ranked #1,012 out of 2,152 schools in the nation that were analyzed for overall quality. This is an improvement over the previous year, when Newman University held the #1,306 spot on the Best Overall Colleges list.
Newman University is also ranked #9 out of 44 schools in Kansas.
Newman University has an acceptance rate of 51%, which means the school is serious about who it admits. Take your time in putting together a strong application that highlights why you are a good fit for Newman University.
The student to faculty ratio is often used to measure the number of teaching resources that a college or university offers its students. The national average for this metric is 15 to 1, but at Newman University it is much better at 10 to 1. That's good news for students who want to interact more on a personal level with their teachers.
Another measure that is often used to estimate how much access students will have to their professors is how many faculty members are full-time. The idea here is that part-time faculty tend to spend less time on campus, so they may not be as available to students as full-timers.
The full-time faculty percentage at Newman University is 100%. This is higher than the national average of 47%.
The freshmen retention rate tells us what percentage of first-year, full-time students choose to continue on to their sophomore year at a particular school. The rate at Newman University is 69%, which is about average when compared to the national rate of 68%.
When it comes to finishing their studies on time, those seeking a bachelor's degree from Newman University have a four-year graduation rate of 38%. This is comparable to the national average of 33.3%
Find out more about the retention and graduation rates at Newman University.
During the 2017-2018 academic year, there were 1,577 undergraduates at Newman University with 915 being full-time and 662 being part-time.
| $0-30 K | $30K-48K | $48-75 | $75-110K | $110K + |
|---|---|---|---|---|
| $13,336 | $12,540 | $20,166 | $22,634 | $23,046 |
The net price is calculated by adding tuition, room, board and other costs and subtracting financial aid.Note that the net price is typically less than the published for a school. For more information on the sticker price of Newman University, see our tuition and fees and room and board pages.
It's not uncommon for college students to take out loans to pay for school. In fact, almost 66% of students nationwide depend at least partially on loans. At Newman University, approximately 36% of students took out student loans averaging $6,484 a year. That adds up to $25,936 over four years for those students.
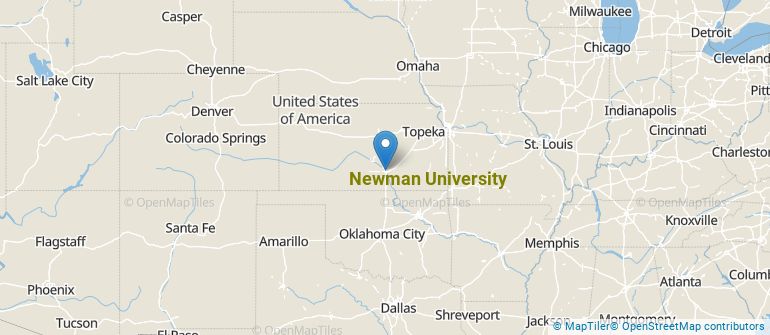
Get more details about the location of Newman University.
Contact details for Newman University are given below.
| Contact Details | |
|---|---|
| Address: | 3100 Mccormick Ave, Wichita, KS 67213-2097 |
| Phone: | 316-942-4291 |
| Website: | www.newmanu.edu/ |
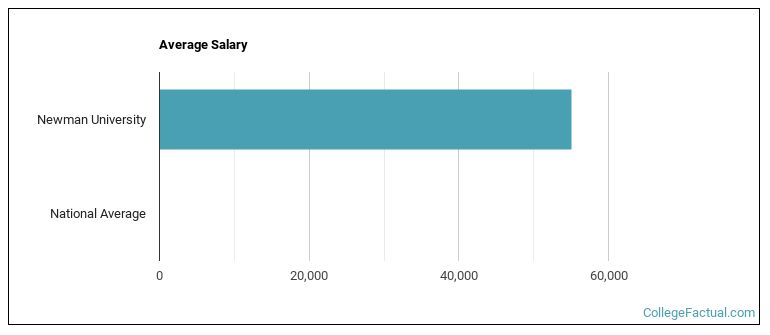
| Most Popular Majors | Bachelor’s Degrees | Average Salary of Graduates |
|---|---|---|
| Teacher Education Grade Specific | 62 | $43,296 |
| Nursing | 62 | $65,957 |
| Social Work | 52 | NA |
| Business Administration & Management | 36 | NA |
| Allied Health Professions | 26 | NA |
| General Biology | 19 | NA |
| Other Education | 17 | NA |
| Other Multi/Interdisciplinary Studies | 16 | $37,399 |
| Criminal Justice & Corrections | 12 | NA |
| Theological & Ministerial Studies | 12 | NA |
Online learning is becoming popular at even the oldest colleges and universities in the United States. Not only are online classes great for returning adults with busy schedules, they are also frequented by a growing number of traditional students.
In 2022-2023, 737 students took at least one online class at Newman University. This is a decrease from the 742 students who took online classes the previous year.
| Year | Took at Least One Online Class | Took All Classes Online |
|---|---|---|
| 2022-2023 | 737 | 126 |
| 2021-2022 | 742 | 181 |
| 2020-2021 | 859 | 204 |
| 2018-2019 | 813 | 290 |
If you’re considering Newman University, here are some more schools you may be interested in knowing more about.
Curious on how these schools stack up against Newman University? Pit them head to head with College Combat, our free interactive tool that lets you compare college on the features that matter most to you!
Footnotes
*The racial-ethnic minorities count is calculated by taking the total number of students and subtracting white students, international students, and students whose race/ethnicity was unknown. This number is then divided by the total number of students at the school to obtain the racial-ethnic minorities percentage.
References
More about our data sources and methodologies.