In its yearly rankings, College Factual analyzes over 2,000 colleges and universities to determine which ones are the best in a variety of categories, such as overall value, quality, diversity, which schools are the best for each major, and much more.
Northeastern Illinois University was awarded 10 badges in the 2025 rankings. The highest ranked major at the school is elementary education.
Explore the best ranked schools for the programs you are most interested in.
College Factual ranked Northeastern Illinois University as #1,459 out of 2,152 colleges and universities in the country on its 2025 Best Colleges list.
Northeastern Illinois University also holds the #59 spot on the Best Colleges in Illinois ranking.
See all of the rankings for Northeastern Illinois University.
Northeastern Illinois University has an acceptance rate of 63%, which means the school is serious about who it admits. Take your time in putting together a strong application that highlights why you are a good fit for Northeastern Illinois University.
At Northeastern Illinois University, the student to faculty ratio is an excellent 9 to 1. That's much better than the national average of 15 to 1. This indicates that many classes will probably be small, and students will have ample opportunites to work closely with their professors and classmates.
When estimating how much access students will have to their teachers, some people like to look at what percentage of faculty members are full time. This is because part-time teachers may not have as much time to spend on campus as their full-time counterparts.
The full-time faculty percentage at Northeastern Illinois University is 57%. This is higher than the national average of 47%.
The freshmen retention rate tells us what percentage of first-year, full-time students choose to continue on to their sophomore year at a particular school. The rate at Northeastern Illinois University is 63%, which is about average when compared to the national rate of 68%.
The on-time graduation rate is the percent of first-time, full time students who obtain their bachelor's degree in four years or less. This rate is 5% for first-time, full-time students at Northeastern Illinois University, which is lower than the national rate of 33.3%.
Find out more about the retention and graduation rates at Northeastern Illinois University.
During the 2017-2018 academic year, there were 5,220 undergraduates at Northeastern Illinois University with 3,019 being full-time and 2,201 being part-time.
The net price is calculated by adding tuition, room, board and other costs and subtracting financial aid.Note that the net price is typically less than the published for a school. For more information on the sticker price of Northeastern Illinois University, see our tuition and fees and room and board pages.
While almost two-thirds of students nationwide take out loans to pay for college, the percentage may be quite different for the school you plan on attending. At Northeastern Illinois University, approximately 9% of students took out student loans averaging $6,513 a year. That adds up to $26,052 over four years for those students.
Get more details about paying for Northeastern Illinois University.
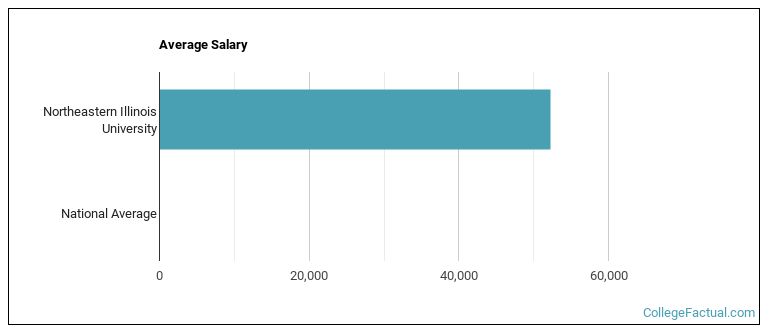
See which majors at Northeastern Illinois University make the most money.
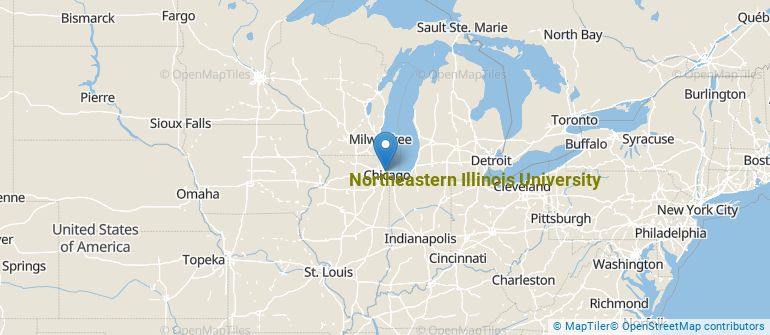
Get more details about the location of Northeastern Illinois University.
Contact details for Northeastern Illinois University are given below.
| Contact Details | |
|---|---|
| Address: | 5500 N Saint Louis Ave, Chicago, IL 60625-4699 |
| Phone: | 773-583-4050 |
| Website: | www.neiu.edu/ |
| Most Popular Majors | Bachelor’s Degrees | Average Salary of Graduates |
|---|---|---|
| Teacher Education Grade Specific | 175 | $41,938 |
| Social Work | 159 | $39,178 |
| Computer Science | 129 | $62,831 |
| Liberal Arts General Studies | 106 | $42,976 |
| Business Administration & Management | 86 | $46,630 |
| Accounting | 85 | $50,475 |
| Educational Administration | 82 | NA |
| General Psychology | 80 | $35,637 |
| General Biology | 70 | $40,392 |
| Special Education | 68 | NA |
Online courses area a great option for busy, working students as well as for those who have scheduling conflicts and want to study on their own time. As time goes by, expect to see more and more online learning options become available.
In 2022-2023, 4,506 students took at least one online class at Northeastern Illinois University. This is a decrease from the 5,208 students who took online classes the previous year.
| Year | Took at Least One Online Class | Took All Classes Online |
|---|---|---|
| 2022-2023 | 4,506 | 2,079 |
| 2021-2022 | 5,208 | 2,576 |
| 2020-2021 | 7,091 | 6,955 |
| 2018-2019 | 1,400 | 197 |
Learn more about online learning at Northeastern Illinois University.
Footnotes
*The racial-ethnic minorities count is calculated by taking the total number of students and subtracting white students, international students, and students whose race/ethnicity was unknown. This number is then divided by the total number of students at the school to obtain the racial-ethnic minorities percentage.
References
More about our data sources and methodologies.