We've gathered data and other essential information about the program, such as the average salary of graduates, ethnicity of students, how many students graduated in recent times, and more. In addition, we cover how Northeastern ranks in comparison to other schools with ee programs.
Jump to any of the following sections:
Northeastern is in the top 10% of the country for ee. More specifically it was ranked #25 out of 281 schools by College Factual. It is also ranked #3 in Massachusetts.
During the 2021-2022 academic year, Northeastern University handed out 87 bachelor's degrees in electrical engineering. This is an increase of 36% over the previous year when 64 degrees were handed out.
In 2022, 175 students received their master’s degree in ee from Northeastern. This makes it the #9 most popular school for ee master’s degree candidates in the country.
In addition, 34 students received their doctoral degrees in ee in 2022, making the school the #16 most popular school in the United States for this category of students.
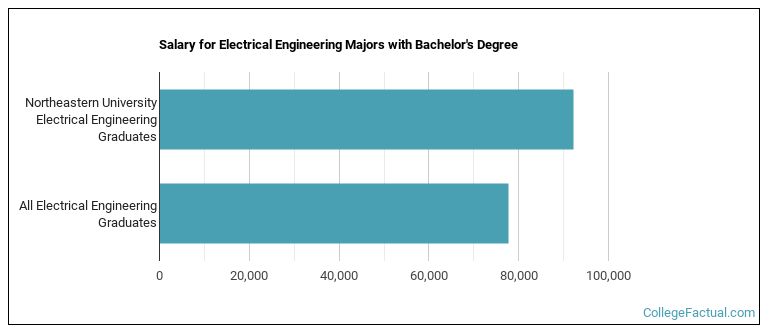
The median salary of ee students who receive their bachelor's degree at Northeastern is $92,222. This is great news for graduates of the program, since this figure is higher than the national average of $77,687 for all ee bachelor's degree recipients.
Part-time undergraduates at Northeastern paid an average of $1,938 per credit hour in 2022-2023. This tuition was the same for both in-state and out-of-state students. The following table shows the average full-time tuition and fees for undergraduates.
| In State | Out of State | |
|---|---|---|
| Tuition | $62,000 | $62,000 |
| Fees | $1,141 | $1,141 |
| Books and Supplies | $1,000 | $1,000 |
| On Campus Room and Board | $18,790 | $18,790 |
| On Campus Other Expenses | $1,800 | $1,800 |
Learn more about Northeastern tuition and fees.
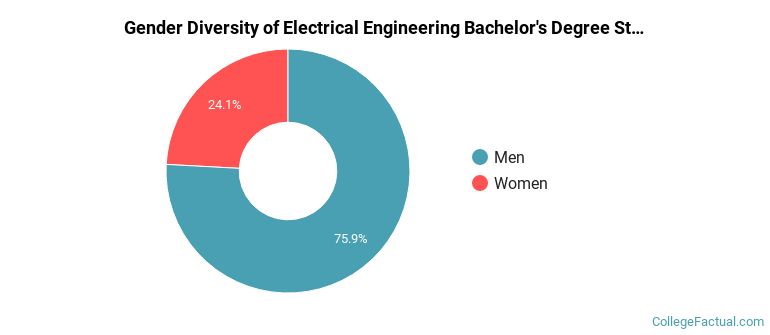
Of the 87 ee students who graduated with a bachelor's degree in 2021-2022 from Northeastern, about 76% were men and 24% were women.
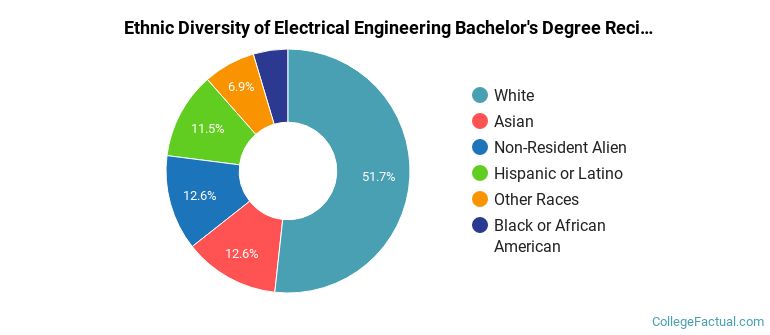
The majority of the students with this major are white. About 52% of 2022 graduates were in this category.
The following table and chart show the ethnic background for students who recently graduated from Northeastern University with a bachelor's in ee.
| Ethnic Background | Number of Students |
|---|---|
| Asian | 11 |
| Black or African American | 4 |
| Hispanic or Latino | 10 |
| White | 45 |
| Non-Resident Aliens | 11 |
| Other Races | 6 |
Online degrees for the Northeastern ee bachelor’s degree program are not available at this time. To see if the school offers distance learning options in other areas, visit the Northeastern Online Learning page.
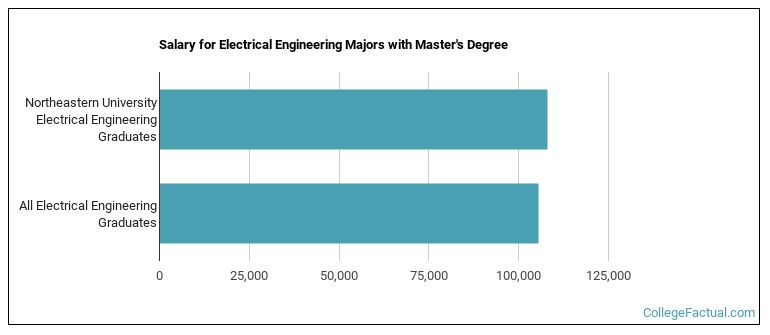
Graduates of the master's ee program at Northeastern make a median salary of $107,951. This is a better than average outcome since the median salary for all ee graduates with a master's is $105,380.
Of the 160 students who graduated with a Master’s in ee from Northeastern in 2022, 82% were men and 18% were women.

The following table and chart show the ethnic background for students who recently graduated from Northeastern University with a master's in ee.
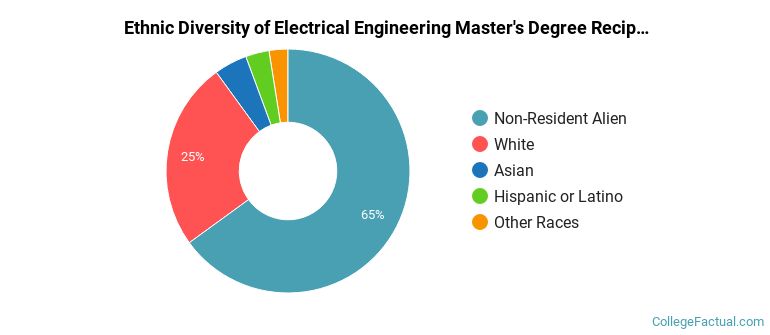
| Ethnic Background | Number of Students |
|---|---|
| Asian | 7 |
| Black or African American | 0 |
| Hispanic or Latino | 5 |
| White | 40 |
| Non-Resident Aliens | 104 |
| Other Races | 4 |
Take a look at the following statistics related to the make-up of the ee majors at Northeastern University.
| Related Major | Annual Graduates |
|---|---|
| Computer Engineering | 717 |
| Other Engineering | 469 |
| Mechanical Engineering | 412 |
| General Engineering | 205 |
| Industrial Engineering | 181 |
More about our data sources and methodologies.