Norwich total enrollment is approximately 3,975 students. 2,522 are undergraduates and 707 are graduate students.
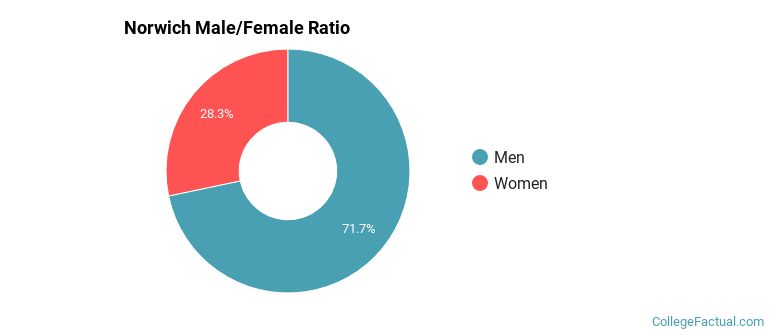
Male/Female Breakdown of Undergraduates
The full-time Norwich undergraduate population is made up of 30% women, and 70% men.
For the gender breakdown for all students, go here.
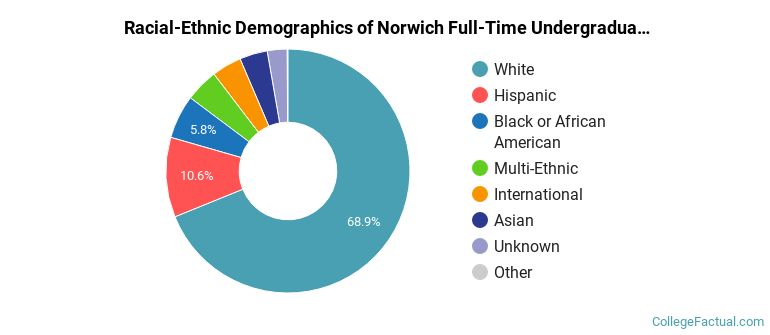
Norwich Racial/Ethnic Breakdown of Undergraduates
| Race/Ethnicity | Number |
|---|---|
| White | 1,691 |
| Hispanic | 265 |
| Unknown | 123 |
| Black or African American | 120 |
| Multi-Ethnic | 116 |
| Asian | 95 |
| International | 91 |
| Native Hawaiian or Pacific Islander | 3 |
See racial/ethnic breakdown for all students.
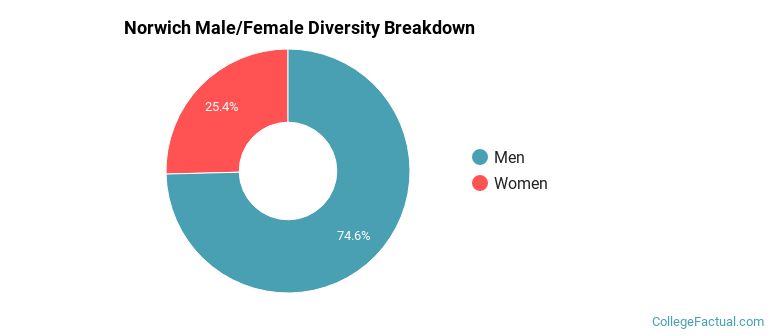
Male/Female Breakdown of Graduate Students
About 32% of full-time grad students are women, and 68% men.

For the gender breakdown for all students, go here.
Norwich Racial-Ethnic Breakdown of Graduate Students

| Race/Ethnicity | Number |
|---|---|
| White | 510 |
| Hispanic | 54 |
| Black or African American | 53 |
| Unknown | 48 |
| Multi-Ethnic | 22 |
| Asian | 14 |
| Native Hawaiian or Pacific Islander | 2 |
| International | 2 |
See racial/ethnic breakdown for all students.

| Race/Ethnicity | Number |
|---|---|
| White | 2,740 |
| Hispanic | 393 |
| Unknown | 228 |
| Black or African American | 204 |
| Multi-Ethnic | 166 |
| Asian | 119 |
| International | 95 |
| Native Hawaiian or Pacific Islander | 6 |
There are approximately 1,054 female students and 2,921 male students at Norwich.
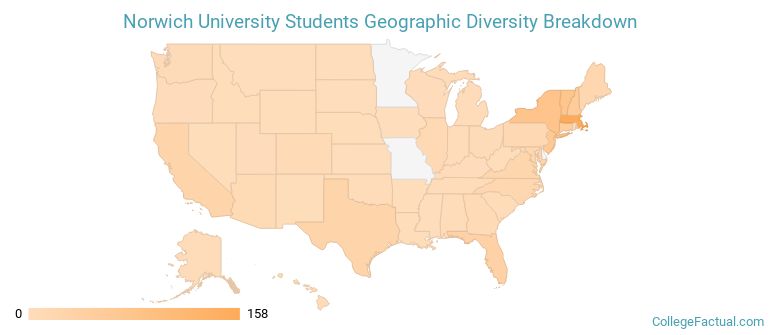
Norwich ranks 61 out of 2,183 when it comes to geographic diversity.
89.81% of Norwich students come from out of state, and 1.63% come from out of the country.
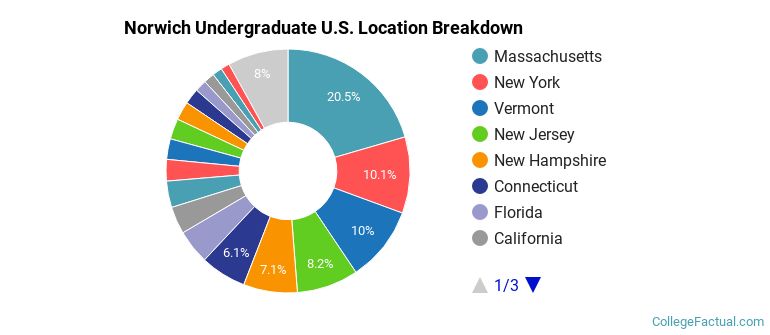
The undergraduate student body is split among 41 states (may include Washington D.C.). Click on the map for more detail.
| State | Amount |
|---|---|
| Massachusetts | 158 |
| New York | 78 |
| Vermont | 77 |
| New Jersey | 63 |
| New Hampshire | 55 |
Students from 32 countries are represented at this school, with the majority of the international students coming from Nepal, Canada, and China.
Learn more about international students at Norwich.
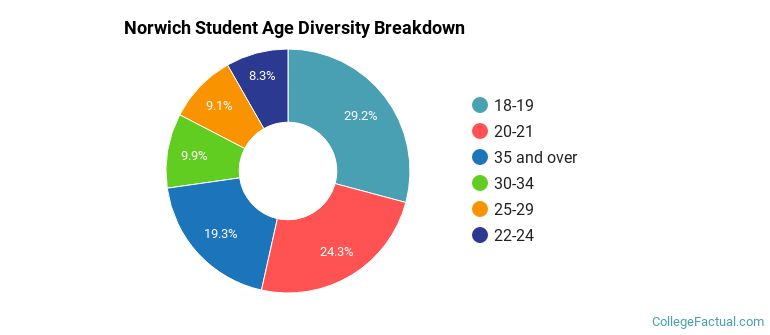
A traditional college student is defined as being between the ages of 18-21. At Norwich, 52.76% of students fall into that category, compared to the national average of 60%.
| Student Age Group | Amount |
|---|---|
| 18-19 | 1,179 |
| 20-21 | 984 |
| 35 and over | 779 |
| 30-34 | 399 |
| 25-29 | 369 |
| 22-24 | 334 |
| Under 18 | 0 |
Footnotes
*The racial-ethnic minorities count is calculated by taking the total number of students and subtracting white students, international students, and students whose race/ethnicity was unknown. This number is then divided by the total number of students at the school to obtain the racial-ethnic minorities percentage.
References
Department of Homeland Security Citizenship and Immigration Services
Find out how College Factual created their Diversity Rankings.