Explore the best ranked schools for the programs you are most interested in.
OWU is ranked #1,372 out of 2,152 schools in the nation for overall quality on College Factual's 2025 Best Colleges list.
OWU also holds the #53 spot on the Best Colleges in Ohio ranking.
If you're applying to Ohio Wesleyan University you'll face some tough competition, since the school's acceptance rate is only 52%. Definitely don't wait until the last minute to submit your application, since applying early may be in your favor.
About 15% of students accepted to OWU submitted their SAT scores. When looking at the 25th through the 75th percentile, SAT Evidence-Based Reading and Writing scores ranged between 570 and 678. Math scores were between 553 and 680.
The student to faculty ratio at OWU is an impressive 11 to 1. That's quite good when you compare it to the national average of 15 to 1. This is a good sign that students at the school will have more opportunities for one-on-one interactions with their professors.
When estimating how much access students will have to their teachers, some people like to look at what percentage of faculty members are full time. This is because part-time teachers may not have as much time to spend on campus as their full-time counterparts.
The full-time faculty percentage at Ohio Wesleyan University is 56%. This is higher than the national average of 47%.
Ohio Wesleyan University has a freshmen retention rate of 82%. That's a good sign that full-time students like the school and their professors enough to want to stick around for another year. It's also a sign that the admissions team did a good job in choosing applicants who were a good fit for the school.
The on-time graduation rate for someone pursuing a bachelor's degree is typically four years. This rate at OWU for first-time, full-time students is 60%, which is better than the national average of 33.3%.
Find out more about the retention and graduation rates at Ohio Wesleyan University.
During the 2017-2018 academic year, there were 1,426 undergraduates at OWU with 1,418 being full-time and 8 being part-time.
| $0-30 K | $30K-48K | $48-75 | $75-110K | $110K + |
|---|---|---|---|---|
| $19,684 | $23,170 | $21,601 | $24,250 | $31,918 |
The net price is calculated by adding tuition, room, board and other costs and subtracting financial aid.Note that the net price is typically less than the published for a school. For more information on the sticker price of OWU, see our tuition and fees and room and board pages.
While almost two-thirds of students nationwide take out loans to pay for college, the percentage may be quite different for the school you plan on attending. At OWU, approximately 65% of students took out student loans averaging $9,349 a year. That adds up to $37,396 over four years for those students.
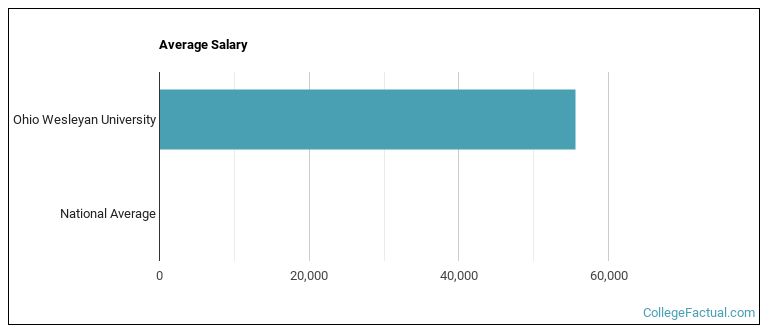
See which majors at Ohio Wesleyan University make the most money.
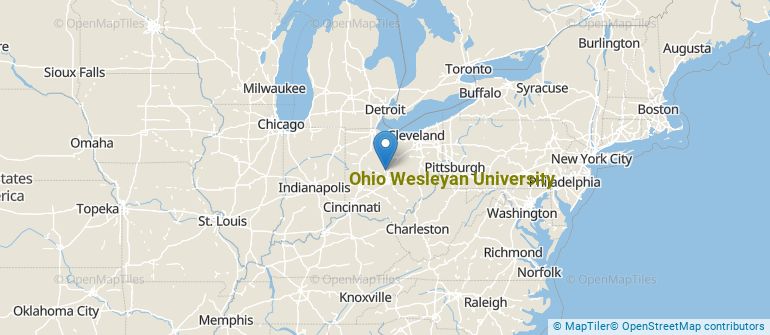
Get more details about the location of Ohio Wesleyan University.
Contact details for OWU are given below.
| Contact Details | |
|---|---|
| Address: | 61 S Sandusky Street, Delaware, OH 43015-2370 |
| Phone: | 740-368-2000 |
| Website: | https://www.owu.edu/ |
| Most Popular Majors | Bachelor’s Degrees | Average Salary of Graduates |
|---|---|---|
| Zoology | 35 | $29,547 |
| General Psychology | 35 | $30,775 |
| Health & Physical Education | 33 | $28,294 |
| Business Administration & Management | 26 | $41,734 |
| Economics | 22 | NA |
| Accounting | 17 | $48,958 |
| Communication & Media Studies | 14 | NA |
| Political Science & Government | 12 | $27,165 |
| Neurobiology & Neurosciences | 11 | NA |
| Special Education | 10 | NA |
If you’re considering Ohio Wesleyan University, here are some more schools you may be interested in knowing more about.
Curious on how these schools stack up against OWU? Pit them head to head with College Combat, our free interactive tool that lets you compare college on the features that matter most to you!
Footnotes
*The racial-ethnic minorities count is calculated by taking the total number of students and subtracting white students, international students, and students whose race/ethnicity was unknown. This number is then divided by the total number of students at the school to obtain the racial-ethnic minorities percentage.
References
More about our data sources and methodologies.