
College Factual recognizes the best colleges and universities in its annual rankings. These rankings include categories for best overall colleges, best colleges for each major, best value schools, and much more.
Oregon State University was awarded 57 badges in the 2025 rankings. The highest ranked major at the school is natural resource management.
Explore the best ranked schools for the programs you are most interested in.
College Factual ranked Oregon State as #238 out of 2,152 colleges and universities in the country on its 2025 Best Colleges list. This puts it in the top 20% of all schools in the nation.
Oregon State also holds the #2 spot on the Best Colleges in Oregon ranking.
When it comes to admittance, Oregon State University is somewhat selective. Its acceptance rate is 83%, which means you'll face some strong competition during the admissions process. Do what you can to make your application stand out.
The student to faculty ratio is often used as a measure to gauge how much access students will have to their professors - the lower the number, the better. At Oregon State University, this rate is 19 to 1, which is high when compared to the national average of 15 to 1.
In addition to the student to faculty ratio, some people look at what percentage of faculty members are full-time as a sign of how much time professors will be able to spend with their students. This is because part-time teachers may not be be on campus as much as their full-time counterparts.
The full-time faculty percentage at Oregon State University is 73%. This is higher than the national average of 47%.
Oregon State University has a freshmen retention rate of 87%. That's a good sign that full-time students like the school and their professors enough to want to stick around for another year. It's also a sign that the admissions team did a good job in choosing applicants who were a good fit for the school.
Students are considered to have graduated on time if they finish their studies within four years. At Oregon State the on-time graduation rate of first-time, full-time students is 41%. That is great when compared to the national average of 33.3%
Find out more about the retention and graduation rates at Oregon State University.
During the 2017-2018 academic year, there were 26,644 undergraduates at Oregon State with 18,084 being full-time and 8,560 being part-time.
| $0-30 K | $30K-48K | $48-75 | $75-110K | $110K + |
|---|---|---|---|---|
| $13,341 | $14,505 | $16,821 | $21,512 | $24,945 |
The net price is calculated by adding tuition, room, board and other costs and subtracting financial aid.Note that the net price is typically less than the published for a school. For more information on the sticker price of Oregon State, see our tuition and fees and room and board pages.
Almost 66% of college students who graduated with the class of 2018 took out student loans, but that percentage varies from school to school. At Oregon State, approximately 34% of students took out student loans averaging $7,622 a year. That adds up to $30,488 over four years for those students.
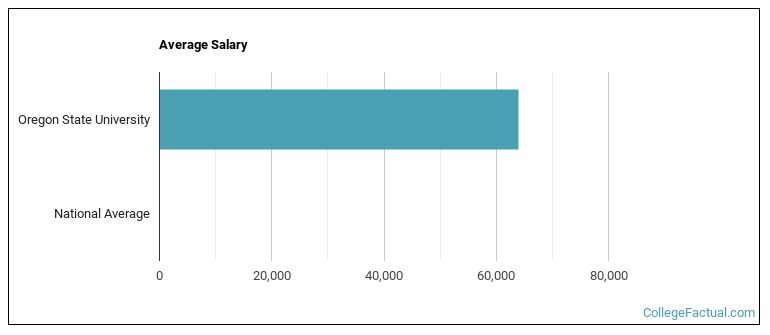
See which majors at Oregon State University make the most money.
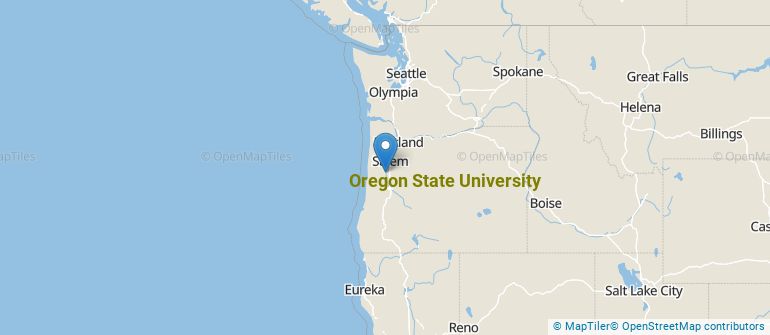
Get more details about the location of Oregon State University.
Contact details for Oregon State are given below.
| Contact Details | |
|---|---|
| Address: | 1500 Sw Jefferson Avenue, Corvallis, OR 97331 |
| Phone: | 541-737-0123 |
| Website: | https://oregonstate.edu/ |
| Most Popular Majors | Bachelor’s Degrees | Average Salary of Graduates |
|---|---|---|
| Computer Science | 985 | $85,376 |
| Mechanical Engineering | 391 | $68,686 |
| Other Multi/Interdisciplinary Studies | 306 | NA |
| General Psychology | 285 | $34,736 |
| Public Health | 226 | $40,682 |
| Human Development & Family Studies | 221 | $33,543 |
| Health & Physical Education | 209 | $29,860 |
| Civil Engineering | 207 | $70,635 |
| General Biology | 202 | $30,982 |
| Natural Resource Management | 182 | $39,422 |
Online learning options are becoming more and more popular at American colleges and universities. Online classes are great for students who have busy schedules or for those who just want to study on their own time.
In 2022-2023, 19,351 students took at least one online class at Oregon State University. This is an increase from the 17,310 students who took online classes the previous year.
| Year | Took at Least One Online Class | Took All Classes Online |
|---|---|---|
| 2022-2023 | 19,351 | 11,727 |
| 2021-2022 | 17,310 | 10,888 |
| 2020-2021 | 16,956 | 8,840 |
| 2018-2019 | 13,482 | 6,565 |
Learn more about online learning at Oregon State University.
If you’re considering Oregon State University, here are some more schools you may be interested in knowing more about.
Curious on how these schools stack up against Oregon State? Pit them head to head with College Combat, our free interactive tool that lets you compare college on the features that matter most to you!
Footnotes
*The racial-ethnic minorities count is calculated by taking the total number of students and subtracting white students, international students, and students whose race/ethnicity was unknown. This number is then divided by the total number of students at the school to obtain the racial-ethnic minorities percentage.
References
More about our data sources and methodologies.