
In its yearly rankings, College Factual analyzes over 2,000 colleges and universities to determine which ones are the best in a variety of categories, such as overall value, quality, diversity, which schools are the best for each major, and much more.
Pacific Union College was awarded 7 badges in the 2025 rankings. The highest ranked major at the school is nursing.
Explore the best ranked schools for the programs you are most interested in.
College Factual ranked PUC as #251 out of 2,152 colleges and universities in the country on its 2025 Best Colleges list. This puts it in the top 20% of all schools in the nation. This is an improvement over the previous year, when PUC held the #450 spot on the Best Overall Colleges list.
PUC is also ranked #38 out of 161 schools in California.
The acceptance rate at Pacific Union College is a competitive 48%, so make sure you take your application seriously when putting it together. Even leaving out a minor detail could be a reason to move you to the rejection pile.
About 35% of students accepted to PUC submitted their SAT scores. When looking at the 25th through the 75th percentile, SAT Evidence-Based Reading and Writing scores ranged between 510 and 610. Math scores were between 480 and 590.
The student to faculty ratio is often used to estimate how much interaction there is between professors and their students at a college or university. At Pacific Union College, this ratio is 13 to 1, which is on par with the national average of 15 to 1. That's not bad at all.
When estimating how much access students will have to their teachers, some people like to look at what percentage of faculty members are full time. This is because part-time teachers may not have as much time to spend on campus as their full-time counterparts.
The full-time faculty percentage at Pacific Union College is 95%. This is higher than the national average of 47%.
Pacific Union College has a freshmen retention rate of 75%. That's a good sign that full-time students like the school and their professors enough to want to stick around for another year. It's also a sign that the admissions team did a good job in choosing applicants who were a good fit for the school.
When it comes to finishing their studies on time, those seeking a bachelor's degree from PUC have a four-year graduation rate of 29%. This is comparable to the national average of 33.3%
Find out more about the retention and graduation rates at Pacific Union College.
During the 2017-2018 academic year, there were 955 undergraduates at PUC with 832 being full-time and 123 being part-time.
| $0-30 K | $30K-48K | $48-75 | $75-110K | $110K + |
|---|---|---|---|---|
| $17,770 | $19,987 | $18,283 | $20,554 | $24,891 |
The net price is calculated by adding tuition, room, board and other costs and subtracting financial aid.Note that the net price is typically less than the published for a school. For more information on the sticker price of PUC, see our tuition and fees and room and board pages.
While almost two-thirds of students nationwide take out loans to pay for college, the percentage may be quite different for the school you plan on attending. At PUC, approximately 67% of students took out student loans averaging $5,455 a year. That adds up to $21,820 over four years for those students.
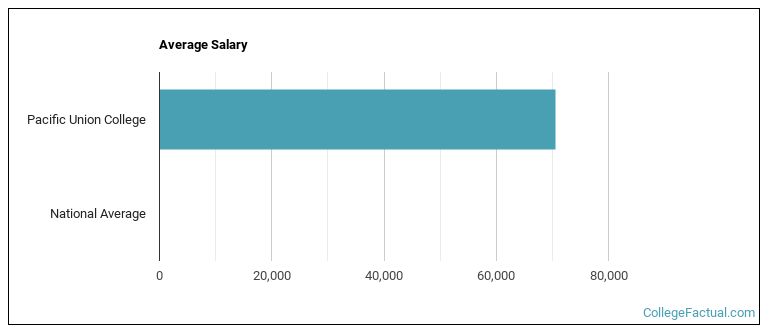
See which majors at Pacific Union College make the most money.
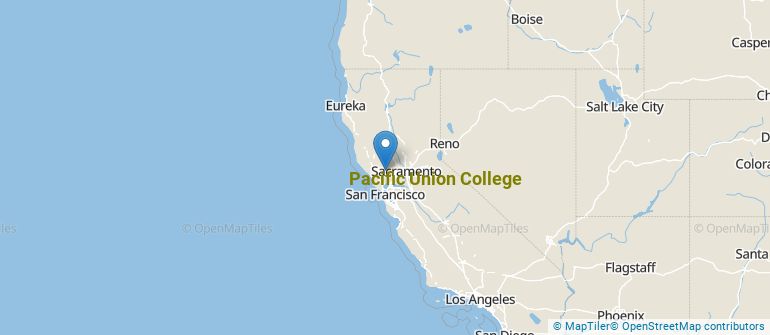
Get more details about the location of Pacific Union College.
Contact details for PUC are given below.
| Contact Details | |
|---|---|
| Address: | One Angwin Ave, Angwin, CA 94508-9707 |
| Phone: | 707-965-6313 |
| Website: | https://www.puc.edu/ |
| Most Popular Majors | Bachelor’s Degrees | Average Salary of Graduates |
|---|---|---|
| Nursing | 116 | $119,258 |
| Health Sciences & Services | 18 | NA |
| General Business/Commerce | 12 | $45,439 |
| Social Work | 10 | NA |
| Film, Video & Photographic Arts | 10 | NA |
| Romance Languages | 6 | NA |
| Allied Health Professions | 6 | NA |
| Health & Physical Education | 6 | NA |
| General Biology | 5 | NA |
| General Psychology | 5 | NA |
Online courses area a great option for busy, working students as well as for those who have scheduling conflicts and want to study on their own time. As time goes by, expect to see more and more online learning options become available.
In 2022-2023, 622 students took at least one online class at Pacific Union College. This is an increase from the 506 students who took online classes the previous year.
| Year | Took at Least One Online Class | Took All Classes Online |
|---|---|---|
| 2022-2023 | 622 | 30 |
| 2021-2022 | 506 | 2 |
| 2020-2021 | 908 | 664 |
| 2018-2019 | 63 | 0 |
If you’re considering Pacific Union College, here are some more schools you may be interested in knowing more about.
Curious on how these schools stack up against PUC? Pit them head to head with College Combat, our free interactive tool that lets you compare college on the features that matter most to you!
Footnotes
*The racial-ethnic minorities count is calculated by taking the total number of students and subtracting white students, international students, and students whose race/ethnicity was unknown. This number is then divided by the total number of students at the school to obtain the racial-ethnic minorities percentage.
References
More about our data sources and methodologies.