In its yearly rankings, College Factual analyzes over 2,000 colleges and universities to determine which ones are the best in a variety of categories, such as overall value, quality, diversity, which schools are the best for each major, and much more.
Parkland College was awarded 2 badges in the 2025 rankings. The highest ranked major at the school is vehicle maintenance & repair.
Explore the best ranked schools for the programs you are most interested in.
Parkland College landed the #1,385 spot in College Factual's 2025 ranking of best overall colleges in the United States. The higher ed experts analyzed 2,152 colleges and universities across the nation to determine this ranking. This is an improvement over the previous year, when Parkland College held the #1,439 spot on the Best Overall Colleges list.
Out of the 85 colleges in Illinois, Parkland College is ranked at #56.
Parkland College has an open admissions policy, so you should not have much trouble being accepted by the school. Still, it is important to fill out the application completely and submit any requested materials, which may include proof that you have a high school diploma or the equivalent.
With a student to faculty ratio of 15 to 1, Parkland College is about average in this regard as the nationwide rate is 15 to 1. While this does not translate directly to class size, it's a good indicator of how much time professors will have to spend with their students on a one-on-one basis.
When estimating how much access students will have to their teachers, some people like to look at what percentage of faculty members are full time. This is because part-time teachers may not have as much time to spend on campus as their full-time counterparts.
The full-time faculty percentage at Parkland College is 43%. This is comparable to the national average of 47%.
The freshmen retention rate tells us what percentage of first-year, full-time students choose to continue on to their sophomore year at a particular school. The rate at Parkland College is 63%, which is about average when compared to the national rate of 68%.
During the 2017-2018 academic year, there were 5,758 undergraduates at Parkland College with 2,282 being full-time and 3,476 being part-time.
| $0-30 K | $30K-48K | $48-75 | $75-110K | $110K + |
|---|---|---|---|---|
| $8,665 | $8,134 | $11,341 | $11,645 | $13,262 |
The net price is calculated by adding tuition, room, board and other costs and subtracting financial aid.Note that the net price is typically less than the published for a school. For more information on the sticker price of Parkland College, see our tuition and fees and room and board pages.
While almost two-thirds of students nationwide take out loans to pay for college, the percentage may be quite different for the school you plan on attending. At Parkland College, approximately 23% of students took out student loans averaging $3,599 a year. That adds up to $14,396 over four years for those students.
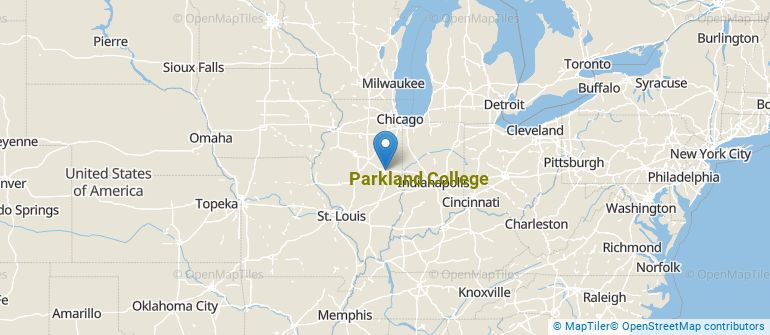
Get more details about the location of Parkland College.
Contact details for Parkland College are given below.
| Contact Details | |
|---|---|
| Address: | 2400 W Bradley Ave, Champaign, IL 61821-1899 |
| Phone: | 217-351-2200 |
| Website: | https://www.parkland.edu/ |
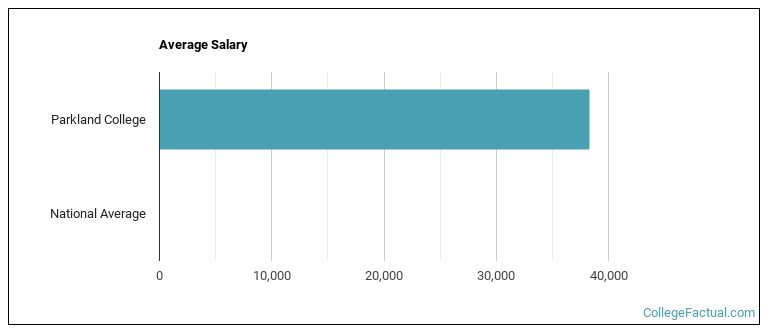
| Most Popular Majors | Bachelor’s Degrees | Average Salary of Graduates |
|---|---|---|
| Liberal Arts General Studies | 438 | NA |
| Practical Nursing & Nursing Assistants | 133 | NA |
| Biological & Physical Science | 116 | NA |
| Allied Health & Medical Assisting Services | 106 | NA |
| Vehicle Maintenance & Repair | 68 | NA |
| Nursing | 66 | NA |
| Allied Health Professions | 64 | NA |
| Air Transportation | 40 | NA |
| Dental Support Services | 36 | NA |
| Information Technology | 33 | NA |
Online courses area a great option for busy, working students as well as for those who have scheduling conflicts and want to study on their own time. As time goes by, expect to see more and more online learning options become available.
In 2022-2023, 2,867 students took at least one online class at Parkland College. This is an increase from the 2,769 students who took online classes the previous year.
| Year | Took at Least One Online Class | Took All Classes Online |
|---|---|---|
| 2022-2023 | 2,867 | 1,087 |
| 2021-2022 | 2,769 | 1,090 |
| 2020-2021 | 3,516 | 1,402 |
| 2018-2019 | 2,778 | 936 |
Footnotes
*The racial-ethnic minorities count is calculated by taking the total number of students and subtracting white students, international students, and students whose race/ethnicity was unknown. This number is then divided by the total number of students at the school to obtain the racial-ethnic minorities percentage.
References
More about our data sources and methodologies.