
In its yearly rankings, College Factual analyzes over 2,000 colleges and universities to determine which ones are the best in a variety of categories, such as overall value, quality, diversity, which schools are the best for each major, and much more.
Princeton University was awarded 38 badges in the 2025 rankings. The highest ranked major at the school is public administration & social service.
Explore the best ranked schools for the programs you are most interested in.
Princeton landed the #27 spot in College Factual's 2025 ranking of best overall colleges in the United States. The higher ed experts analyzed 2,152 colleges and universities across the nation to determine this ranking. This puts it in the top 5% of all schools in the nation.
Princeton also holds the #1 spot on the Best Colleges in New Jersey ranking.
With an acceptance rate of 6%, Princeton is one of the most selective schools in the country. Good grades and high test scores alone may not be enough to get you into the school, so do your best to submit a stellar application.
About 59% of students accepted to Princeton submitted their SAT scores. When looking at the 25th through the 75th percentile, SAT Evidence-Based Reading and Writing scores ranged between 730 and 780. Math scores were between 760 and 800.
At Princeton, the student to faculty ratio is an excellent 5 to 1. That's much better than the national average of 15 to 1. This indicates that many classes will probably be small, and students will have ample opportunites to work closely with their professors and classmates.
When estimating how much access students will have to their teachers, some people like to look at what percentage of faculty members are full time. This is because part-time teachers may not have as much time to spend on campus as their full-time counterparts.
The full-time faculty percentage at Princeton University is 85%. This is higher than the national average of 47%.
The freshmen retention rate of 97% tells us that most first-year, full-time students like Princeton University enough to come back for another year. This is a fair bit higher than the national average of 68%. That's certainly something to check off in the good column about the school.
Students are considered to have graduated on time if they finish their studies within four years. At Princeton the on-time graduation rate of first-time, full-time students is 90%. That is great when compared to the national average of 33.3%
Find out more about the retention and graduation rates at Princeton University.
During the 2017-2018 academic year, there were 4,774 undergraduates at Princeton with 4,689 being full-time and 85 being part-time.
| $0-30 K | $30K-48K | $48-75 | $75-110K | $110K + |
|---|---|---|---|---|
| $2,841 | $2,370 | $6,943 | $13,557 | $36,082 |
The net price is calculated by adding tuition, room, board and other costs and subtracting financial aid.Note that the net price is typically less than the published for a school. For more information on the sticker price of Princeton, see our tuition and fees and room and board pages.
While almost two-thirds of students nationwide take out loans to pay for college, the percentage may be quite different for the school you plan on attending. At Princeton, approximately 6% of students took out student loans averaging $7,559 a year. That adds up to $30,236 over four years for those students.
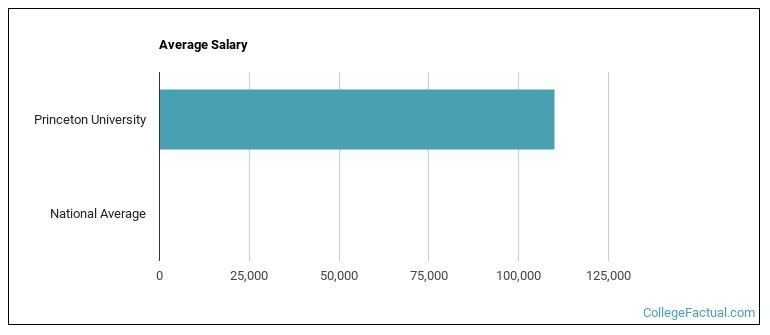
See which majors at Princeton University make the most money.
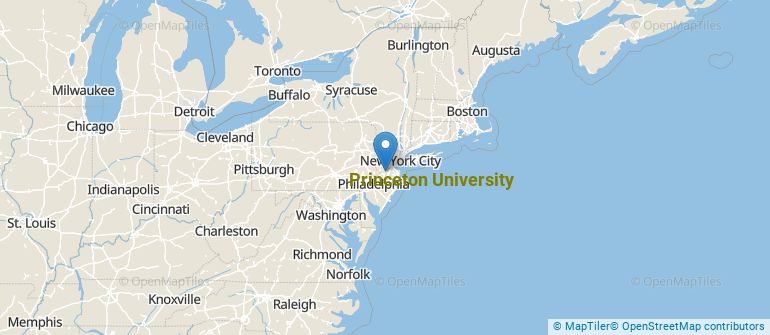
Get more details about the location of Princeton University.
Contact details for Princeton are given below.
| Contact Details | |
|---|---|
| Address: | 1 Nassau Hall, Princeton, NJ 08544-0070 |
| Phone: | 609-258-3000 |
| Website: | www.princeton.edu/ |
| Most Popular Majors | Bachelor’s Degrees | Average Salary of Graduates |
|---|---|---|
| Computer Science | 253 | $146,624 |
| Public Policy | 210 | $73,630 |
| Economics | 166 | $103,041 |
| History | 120 | $45,363 |
| Electrical Engineering | 119 | NA |
| Mechanical Engineering | 110 | $85,328 |
| Chemistry | 103 | NA |
| Political Science & Government | 100 | $63,317 |
| Biochemistry, Biophysics & Molecular Biology | 96 | $41,848 |
| Operations Research | 91 | $100,354 |
If you’re considering Princeton University, here are some more schools you may be interested in knowing more about.
Curious on how these schools stack up against Princeton? Pit them head to head with College Combat, our free interactive tool that lets you compare college on the features that matter most to you!
Footnotes
*The racial-ethnic minorities count is calculated by taking the total number of students and subtracting white students, international students, and students whose race/ethnicity was unknown. This number is then divided by the total number of students at the school to obtain the racial-ethnic minorities percentage.
References
More about our data sources and methodologies.