College Factual analyzes over 2,000 colleges and universities in its annual rankings and ranks them in a variety of ways, including most diverse, best overall quality, best for non-traditional students, and much more.
San Antonio College was awarded 2 badges in the 2025 rankings. The highest ranked major at the school is substance abuse/addiction counseling.
Explore the best ranked schools for the programs you are most interested in.
San Antonio College landed the #1,357 spot in College Factual's 2025 ranking of best overall colleges in the United States. The higher ed experts analyzed 2,152 colleges and universities across the nation to determine this ranking.
San Antonio College also holds the #60 spot on the Best Colleges in Texas ranking.
Returning adults and other non-traditional students may appreciate the fact that San Antonio College has an open admissions policy. This means that you'll only have to submit basic materials, which may include proof that you completed high school or an equivalent program.
The student to faculty ratio at San Antonio College is 24 to 1, which is high when compared to the national average of 15 to 1. This may indicate that some of your classes will be larger in size than they would be at other schools. However, upper level classes will probably be smaller.
Another measure that is often used to estimate how much access students will have to their professors is how many faculty members are full-time. The idea here is that part-time faculty tend to spend less time on campus, so they may not be as available to students as full-timers.
The full-time faculty percentage at San Antonio College is 53%. This is higher than the national average of 47%.
The freshmen retention rate of 46% tells us that most first-year, full-time students don't stick around for a second year at San Antonio College. Students may have a variety of reasons for this, such as only intending to attend a school for one year while they brush up on certain subjects.
During the 2017-2018 academic year, there were 19,231 undergraduates at San Antonio College with 3,685 being full-time and 15,546 being part-time.
| $0-30 K | $30K-48K | $48-75 | $75-110K | $110K + |
|---|---|---|---|---|
| $6,303 | $6,656 | $8,246 | $10,104 | $11,834 |
The net price is calculated by adding tuition, room, board and other costs and subtracting financial aid.Note that the net price is typically less than the published for a school. For more information on the sticker price of San Antonio College, see our tuition and fees and room and board pages.
It's not uncommon for college students to take out loans to pay for school. In fact, almost 66% of students nationwide depend at least partially on loans. At San Antonio College, approximately 6% of students took out student loans averaging $5,665 a year. That adds up to $22,660 over four years for those students.
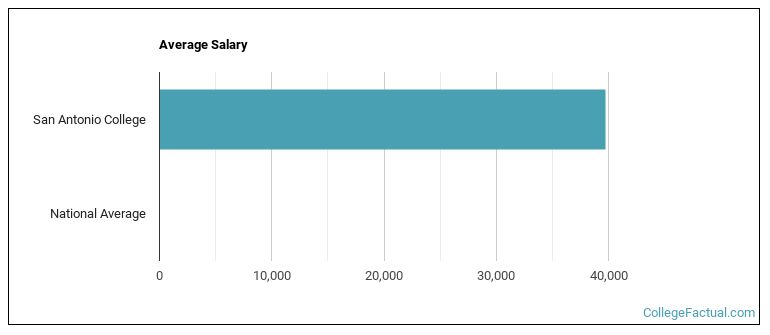
See which majors at San Antonio College make the most money.
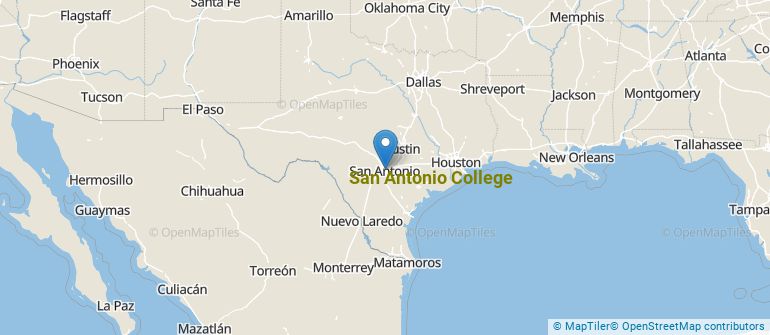
Get more details about the location of San Antonio College.
Contact details for San Antonio College are given below.
| Contact Details | |
|---|---|
| Address: | 1819 N. Main Ave.,, San Antonio, TX 78212-3941 |
| Phone: | 210-486-0000 |
| Website: | www.alamo.edu/sac |
| Most Popular Majors | Bachelor’s Degrees | Average Salary of Graduates |
|---|---|---|
| Liberal Arts General Studies | 2,163 | NA |
| Nursing | 205 | NA |
| Information Technology | 122 | NA |
| Fire Protection | 107 | NA |
| Criminal Justice & Corrections | 94 | NA |
| Teacher Education Grade Specific | 85 | NA |
| Business Administration & Management | 66 | NA |
| Mental & Social Health Services | 53 | NA |
| Human Development & Family Studies | 49 | NA |
| Arts & Media Management | 45 | NA |
Online learning is becoming popular at even the oldest colleges and universities in the United States. Not only are online classes great for returning adults with busy schedules, they are also frequented by a growing number of traditional students.
In 2022-2023, 11,834 students took at least one online class at San Antonio College. This is an increase from the 9,331 students who took online classes the previous year.
| Year | Took at Least One Online Class | Took All Classes Online |
|---|---|---|
| 2022-2023 | 11,834 | 6,642 |
| 2021-2022 | 9,331 | 6,825 |
| 2020-2021 | 10,270 | 6,470 |
| 2018-2019 | 6,350 | 3,797 |
Footnotes
*The racial-ethnic minorities count is calculated by taking the total number of students and subtracting white students, international students, and students whose race/ethnicity was unknown. This number is then divided by the total number of students at the school to obtain the racial-ethnic minorities percentage.
References
More about our data sources and methodologies.