College Factual recognizes the best colleges and universities in its annual rankings. These rankings include categories for best overall colleges, best colleges for each major, best value schools, and much more.
San Joaquin Valley College-Ontario was awarded 10 badges in the 2025 rankings. The highest ranked major at the school is dental support services.
Explore the best ranked schools for the programs you are most interested in.
was not ranked in College Factual's 2025 Best Overall Colleges report. This could be for a number of reasons, including lack of data.
See all of the rankings for San Joaquin Valley College-Ontario.
San Joaquin Valley College-Ontario has an open admissions policy, so you should not have much trouble being accepted by the school. Still, it is important to fill out the application completely and submit any requested materials, which may include proof that you have a high school diploma or the equivalent.
At San Joaquin Valley College-Ontario, the student to faculty ratio is 19 to 1. Compared to the national average of 15 to 1, this is somewhat high. This could mean that class sizes may be larger than they are at other colleges or universities or that professors may be required to teach more classes.
In addition to the student to faculty ratio, some people look at what percentage of faculty members are full-time as a sign of how much time professors will be able to spend with their students. This is because part-time teachers may not be be on campus as much as their full-time counterparts.
The full-time faculty percentage at San Joaquin Valley College-Ontario is 24%. This is lower than the national average of 47%.
The freshmen retention rate of 76% tells us that most first-year, full-time students like San Joaquin Valley College-Ontario enough to come back for another year. This is a fair bit higher than the national average of 68%. That's certainly something to check off in the good column about the school.
During the 2017-2018 academic year, there were 862 full-time undergraduates at .
Almost 66% of college students who graduated with the class of 2018 took out student loans, but that percentage varies from school to school. At , approximately 77% of students took out student loans averaging $7,601 a year. That adds up to $30,404 over four years for those students.
Get more details about paying for San Joaquin Valley College-Ontario.
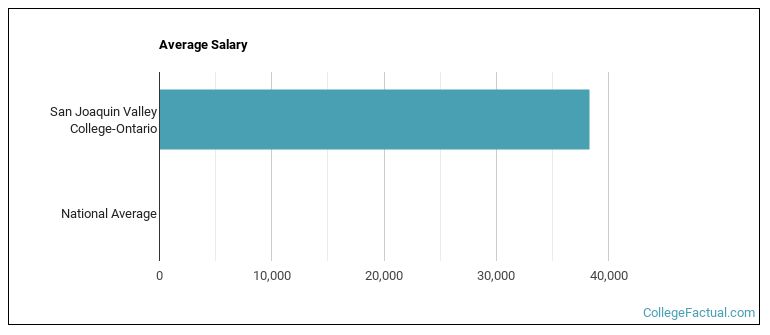
See which majors at San Joaquin Valley College-Ontario make the most money.
Get more details about the location of San Joaquin Valley College-Ontario.

Contact details for are given below.
| Contact Details | |
|---|---|
| Address: | 4580 Ontario Mills Parkway, Ontario, CA 91764-5107 |
| Phone: | 559-734-9000 |
| Website: | sjvc.edu/ |
| Most Popular Majors | Bachelor’s Degrees | Average Salary of Graduates |
|---|---|---|
| Electrical & Power Transmission Installers | 126 | NA |
| Allied Health & Medical Assisting Services | 90 | NA |
| Allied Health Professions | 50 | NA |
| Nursing | 34 | NA |
| Heating, Air Conditioning, Ventilation & Refrigeration | 32 | NA |
| Dental Support Services | 28 | NA |
| Criminal Justice & Corrections | 22 | NA |
| Heavy/Industrial Equipment Maintenance | 18 | NA |
| Business Support & Assistant Services | 10 | NA |
| Construction Management | 9 | NA |
Online learning options are becoming more and more popular at American colleges and universities. Online classes are great for students who have busy schedules or for those who just want to study on their own time.
In 2022-2023, 298 students took at least one online class at San Joaquin Valley College-Ontario. This is an increase from the 189 students who took online classes the previous year.
| Year | Took at Least One Online Class | Took All Classes Online |
|---|---|---|
| 2022-2023 | 298 | 0 |
| 2021-2022 | 189 | 0 |
| 2020-2021 | 283 | 0 |
Learn more about online learning at San Joaquin Valley College-Ontario.
Footnotes
*The racial-ethnic minorities count is calculated by taking the total number of students and subtracting white students, international students, and students whose race/ethnicity was unknown. This number is then divided by the total number of students at the school to obtain the racial-ethnic minorities percentage.
References
More about our data sources and methodologies.