Explore the best ranked schools for the programs you are most interested in.
According to College Factual's 2025 analysis, Shawnee State University is ranked #1,716 out of 2,152 schools in the nation that were analyzed for overall quality. This is an improvement over the previous year, when Shawnee State University held the #1,923 spot on the Best Overall Colleges list.
Out of the 91 colleges in Ohio, Shawnee State University is ranked at #68.
Returning adults and other non-traditional students may appreciate the fact that Shawnee State University has an open admissions policy. This means that you'll only have to submit basic materials, which may include proof that you completed high school or an equivalent program.
The student to faculty ratio at Shawnee State University is about average at 14 to 1. This ratio is often used to gauge how many students might be in an average class and how much time professors will have to spend with their students on an individual level. The national average for this metric is 15 to 1.
When estimating how much access students will have to their teachers, some people like to look at what percentage of faculty members are full time. This is because part-time teachers may not have as much time to spend on campus as their full-time counterparts.
The full-time faculty percentage at Shawnee State University is 33%. This is lower than the national average of 47%.
The freshmen retention rate tells us what percentage of first-year, full-time students choose to continue on to their sophomore year at a particular school. The rate at Shawnee State University is 66%, which is about average when compared to the national rate of 68%.
When we say that a student has graduated on time, we mean that they have finished their bachelor's degree within four years. The on-time graduation rate at Shawnee State University is 27%. That's lower than the national rate of 33.3%
Find out more about the retention and graduation rates at Shawnee State University.
During the 2017-2018 academic year, there were 3,304 undergraduates at Shawnee State University with 2,521 being full-time and 783 being part-time.
| $0-30 K | $30K-48K | $48-75 | $75-110K | $110K + |
|---|---|---|---|---|
| $11,546 | $11,631 | $15,410 | $18,025 | $18,348 |
The net price is calculated by adding tuition, room, board and other costs and subtracting financial aid.Note that the net price is typically less than the published for a school. For more information on the sticker price of Shawnee State University, see our tuition and fees and room and board pages.
While almost two-thirds of students nationwide take out loans to pay for college, the percentage may be quite different for the school you plan on attending. At Shawnee State University, approximately 51% of students took out student loans averaging $7,717 a year. That adds up to $30,868 over four years for those students.
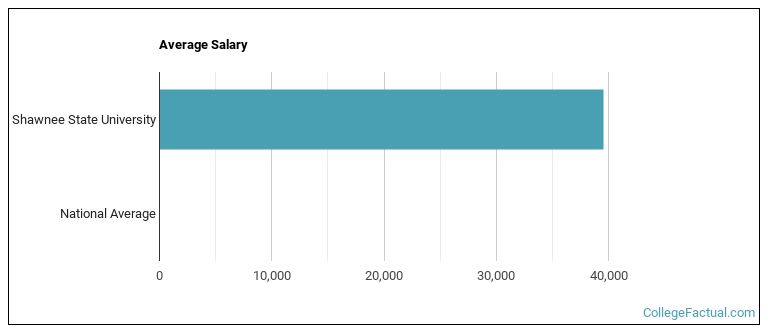
See which majors at Shawnee State University make the most money.
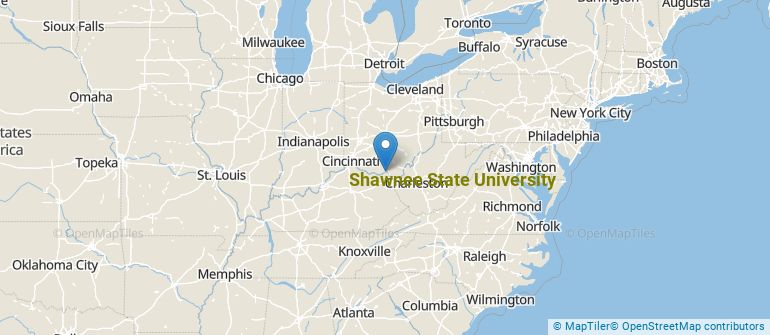
Get more details about the location of Shawnee State University.
Contact details for Shawnee State University are given below.
| Contact Details | |
|---|---|
| Address: | 940 Second Street, Portsmouth, OH 45662 |
| Phone: | 740-354-3205 |
| Website: | https://www.shawnee.edu/ |
| Most Popular Majors | Bachelor’s Degrees | Average Salary of Graduates |
|---|---|---|
| Health & Medical Administrative Services | 65 | $45,324 |
| Nursing | 57 | $67,126 |
| Allied Health & Medical Assisting Services | 42 | NA |
| Rehabilitation & Therapeutic Professions | 38 | NA |
| General Biology | 37 | NA |
| Liberal Arts General Studies | 32 | NA |
| Fine & Studio Arts | 29 | $19,261 |
| Business Administration & Management | 29 | $36,224 |
| Special Education | 24 | $37,020 |
| Allied Health Professions | 23 | $50,391 |
Online courses area a great option for busy, working students as well as for those who have scheduling conflicts and want to study on their own time. As time goes by, expect to see more and more online learning options become available.
In 2022-2023, 2,336 students took at least one online class at Shawnee State University. This is an increase from the 2,239 students who took online classes the previous year.
| Year | Took at Least One Online Class | Took All Classes Online |
|---|---|---|
| 2022-2023 | 2,336 | 408 |
| 2021-2022 | 2,239 | 387 |
| 2020-2021 | 1,471 | 219 |
| 2018-2019 | 576 | 37 |
Learn more about online learning at Shawnee State University.
If you’re considering Shawnee State University, here are some more schools you may be interested in knowing more about.
Curious on how these schools stack up against Shawnee State University? Pit them head to head with College Combat, our free interactive tool that lets you compare college on the features that matter most to you!
Footnotes
*The racial-ethnic minorities count is calculated by taking the total number of students and subtracting white students, international students, and students whose race/ethnicity was unknown. This number is then divided by the total number of students at the school to obtain the racial-ethnic minorities percentage.
References
More about our data sources and methodologies.