STJ total enrollment is approximately 20,143 students. 10,177 are undergraduates and 2,749 are graduate students.
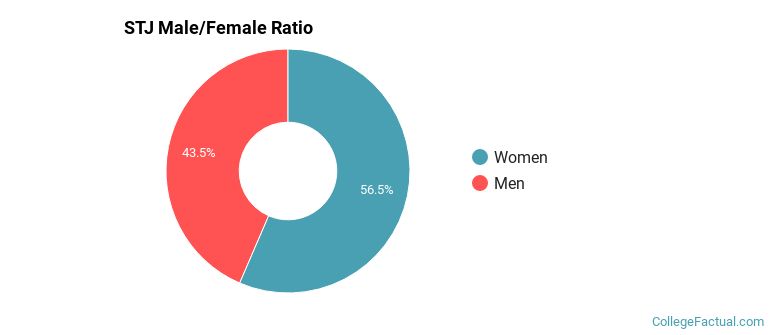
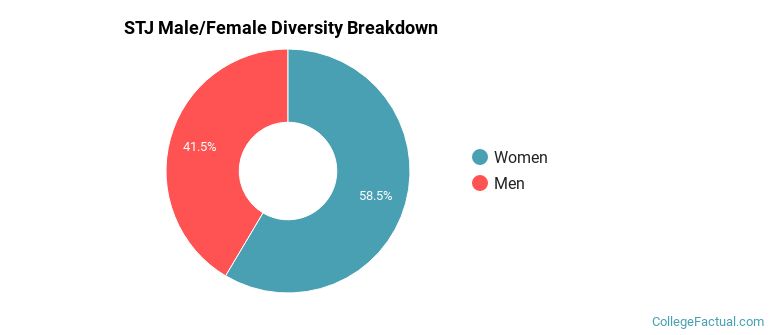
Male/Female Breakdown of Undergraduates
The full-time STJ undergraduate population is made up of 56% women, and 44% men.
For the gender breakdown for all students, go here.
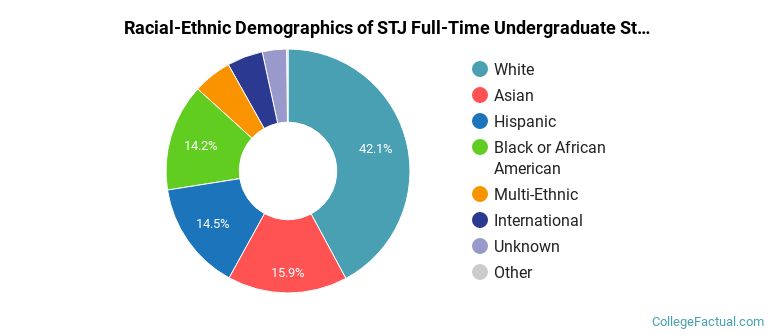
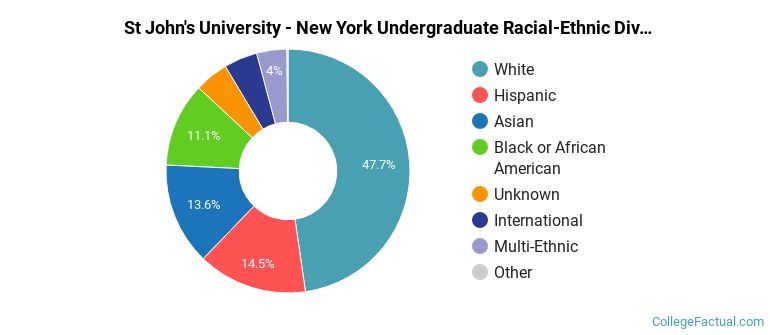
STJ Racial/Ethnic Breakdown of Undergraduates
| Race/Ethnicity | Number |
|---|---|
| White | 4,290 |
| Hispanic | 1,727 |
| Asian | 1,677 |
| Black or African American | 1,371 |
| Multi-Ethnic | 491 |
| International | 357 |
| Unknown | 220 |
| Native Hawaiian or Pacific Islander | 12 |
See racial/ethnic breakdown for all students.
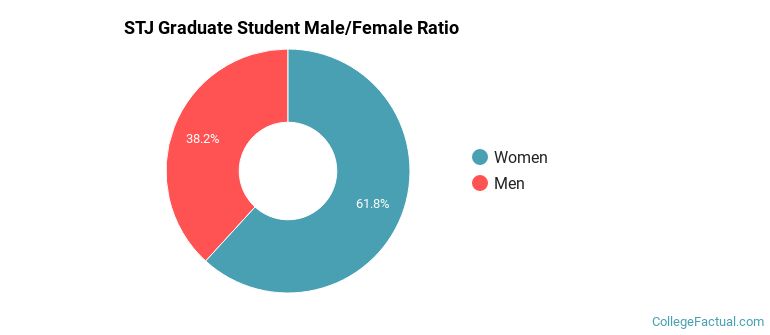
Male/Female Breakdown of Graduate Students
About 62% of full-time grad students are women, and 38% men.
For the gender breakdown for all students, go here.
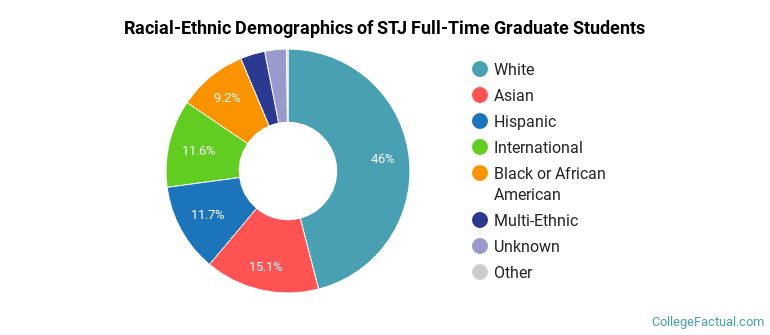
STJ Racial-Ethnic Breakdown of Graduate Students
| Race/Ethnicity | Number |
|---|---|
| White | 1,372 |
| Asian | 378 |
| Hispanic | 343 |
| Black or African American | 243 |
| International | 236 |
| Multi-Ethnic | 112 |
| Unknown | 56 |
| Native Hawaiian or Pacific Islander | 5 |
See racial/ethnic breakdown for all students.
| Race/Ethnicity | Number |
|---|---|
| White | 9,847 |
| Hispanic | 3,248 |
| Asian | 2,630 |
| Black or African American | 2,100 |
| Multi-Ethnic | 810 |
| Unknown | 750 |
| International | 693 |
| Native Hawaiian or Pacific Islander | 21 |
There are approximately 11,847 female students and 8,296 male students at STJ.
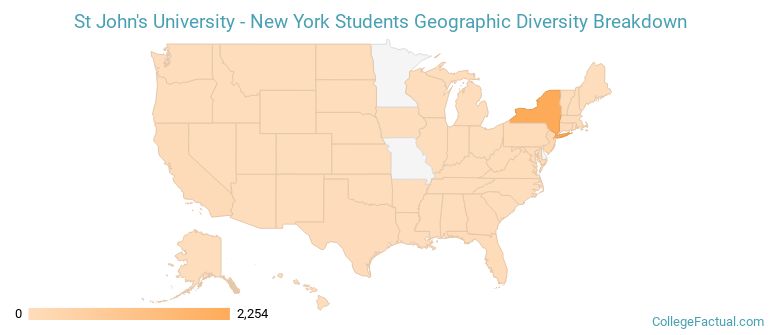
STJ ranks 587 out of 2,183 when it comes to geographic diversity.
26.44% of STJ students come from out of state, and 5.3% come from out of the country.
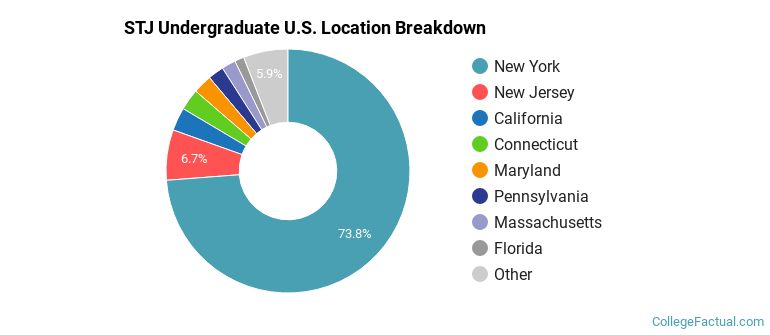
The undergraduate student body is split among 32 states (may include Washington D.C.). Click on the map for more detail.
| State | Amount |
|---|---|
| New York | 2,254 |
| New Jersey | 204 |
| California | 94 |
| Connecticut | 86 |
| Maryland | 77 |
Students from 103 countries are represented at this school, with the majority of the international students coming from China, India, and South Korea.
Learn more about international students at STJ.
A traditional college student is defined as being between the ages of 18-21. At STJ, 48.70% of students fall into that category, compared to the national average of 60%.
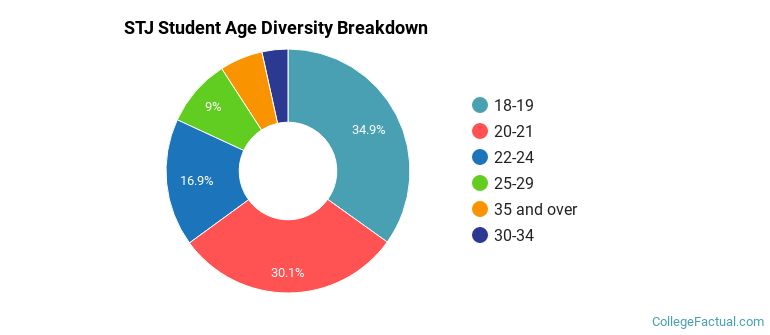
| Student Age Group | Amount |
|---|---|
| 18-19 | 5,580 |
| 20-21 | 4,812 |
| 22-24 | 2,707 |
| 25-29 | 1,433 |
| 35 and over | 913 |
| 30-34 | 551 |
| Under 18 | 0 |
Footnotes
*The racial-ethnic minorities count is calculated by taking the total number of students and subtracting white students, international students, and students whose race/ethnicity was unknown. This number is then divided by the total number of students at the school to obtain the racial-ethnic minorities percentage.
References
Department of Homeland Security Citizenship and Immigration Services
Learn more about how College Factual creates their Diversity Rankings.