College Factual recognizes the best colleges and universities in its annual rankings. These rankings include categories for best overall colleges, best colleges for each major, best value schools, and much more.
Stevenson University was awarded 13 badges in the 2025 rankings. The highest ranked major at the school is homeland security, law enforcement & firefighting.
Explore the best ranked schools for the programs you are most interested in.
Stevenson is ranked #792 out of 2,152 schools in the nation for overall quality on College Factual's 2025 Best Colleges list. This is an improvement over the previous year, when Stevenson held the #1,028 spot on the Best Overall Colleges list.
Stevenson is also ranked #18 out of 35 schools in Maryland.
The acceptance rate at Stevenson University is 84%. That's higher than the rate at many schools, but still low enough to be considered somewhat selective. If you want to get in, you'll need good grades and to be able to show that Stevenson is a good fit for you.
With a student to faculty ratio of 15 to 1, Stevenson University is about average in this regard as the nationwide rate is 15 to 1. While this does not translate directly to class size, it's a good indicator of how much time professors will have to spend with their students on a one-on-one basis.
In addition to the student to faculty ratio, some people look at what percentage of faculty members are full-time as a sign of how much time professors will be able to spend with their students. This is because part-time teachers may not be be on campus as much as their full-time counterparts.
The full-time faculty percentage at Stevenson University is 29%. This is lower than the national average of 47%.
Stevenson University has a freshmen retention rate of 77%. That's a good sign that full-time students like the school and their professors enough to want to stick around for another year. It's also a sign that the admissions team did a good job in choosing applicants who were a good fit for the school.
The on-time graduation rate for someone pursuing a bachelor's degree is typically four years. This rate at Stevenson for first-time, full-time students is 51%, which is better than the national average of 33.3%.
Find out more about the retention and graduation rates at Stevenson University.
During the 2017-2018 academic year, there were 3,027 undergraduates at Stevenson with 2,680 being full-time and 347 being part-time.
| $0-30 K | $30K-48K | $48-75 | $75-110K | $110K + |
|---|---|---|---|---|
| $18,283 | $23,357 | $27,138 | $29,574 | $30,648 |
The net price is calculated by adding tuition, room, board and other costs and subtracting financial aid.Note that the net price is typically less than the published for a school. For more information on the sticker price of Stevenson, see our tuition and fees and room and board pages.
Almost 66% of college students who graduated with the class of 2018 took out student loans, but that percentage varies from school to school. At Stevenson, approximately 54% of students took out student loans averaging $9,446 a year. That adds up to $37,784 over four years for those students.
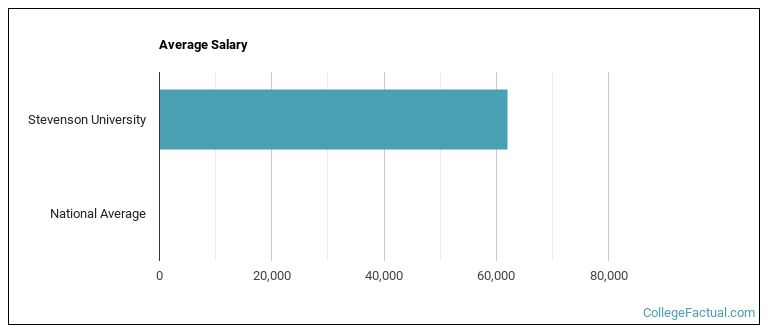
See which majors at Stevenson University make the most money.
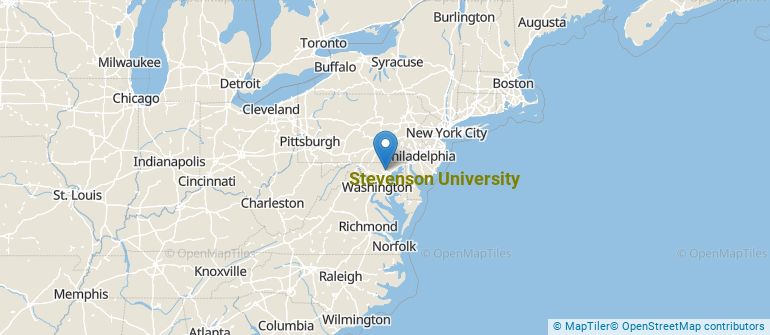
Get more details about the location of Stevenson University.
Contact details for Stevenson are given below.
| Contact Details | |
|---|---|
| Address: | 100 Campus Circle, Owings Mills, MD 21117 |
| Phone: | 410-486-7000 |
| Website: | www.stevenson.edu/ |
| Most Popular Majors | Bachelor’s Degrees | Average Salary of Graduates |
|---|---|---|
| Radio, Television & Digital Communication | 237 | NA |
| Nursing | 237 | $79,709 |
| Security Science and Technology | 89 | NA |
| Business Administration & Management | 74 | $52,442 |
| General Biology | 52 | $32,983 |
| General Psychology | 49 | $28,182 |
| Criminal Justice & Corrections | 42 | $38,745 |
| Legal Support Services | 32 | $46,661 |
| Teacher Education Grade Specific | 31 | $52,395 |
| Other Multi/Interdisciplinary Studies | 29 | $35,723 |
Online learning options are becoming more and more popular at American colleges and universities. Online classes are great for students who have busy schedules or for those who just want to study on their own time.
In 2022-2023, 2,175 students took at least one online class at Stevenson University. This is a decrease from the 2,301 students who took online classes the previous year.
| Year | Took at Least One Online Class | Took All Classes Online |
|---|---|---|
| 2022-2023 | 2,175 | 777 |
| 2021-2022 | 2,301 | 720 |
| 2020-2021 | 2,794 | 731 |
| 2018-2019 | 1,966 | 733 |
If you’re considering Stevenson University, here are some more schools you may be interested in knowing more about.
Curious on how these schools stack up against Stevenson? Pit them head to head with College Combat, our free interactive tool that lets you compare college on the features that matter most to you!
Footnotes
*The racial-ethnic minorities count is calculated by taking the total number of students and subtracting white students, international students, and students whose race/ethnicity was unknown. This number is then divided by the total number of students at the school to obtain the racial-ethnic minorities percentage.
References
More about our data sources and methodologies.