We've gathered data and other essential information about the program, such as the average salary of graduates, ethnicity of students, how many students graduated in recent times, and more. In addition, we cover how Temple ranks in comparison to other schools with general business programs.
Go directly to any of the following sections:
Temple is in the top 10% of the country for general business. More specifically it was ranked #38 out of 421 schools by College Factual. It is also ranked #4 in Pennsylvania.
| Ranking Type | Rank |
|---|---|
| Best General Business/Commerce Bachelor’s Degree Schools | 30 |
| Best General Business/Commerce Schools | 38 |
During the 2021-2022 academic year, Temple University handed out 143 bachelor's degrees in general business/commerce. This is a decrease of 21% over the previous year when 182 degrees were handed out.
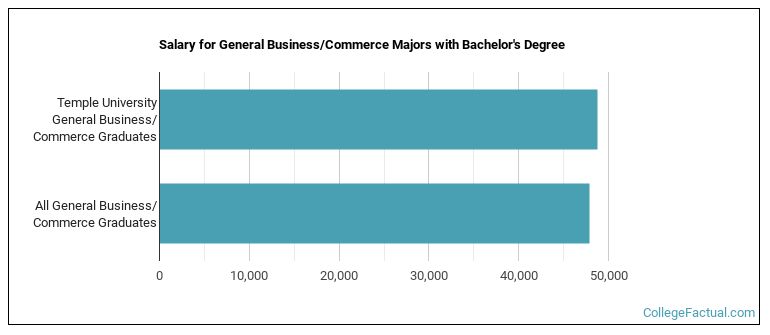
General Business majors who earn their bachelor's degree from Temple go on to jobs where they make a median salary of $48,747 a year. This is great news for graduates of the program, since this figure is higher than the national average of $47,842 for all general business bachelor's degree recipients.
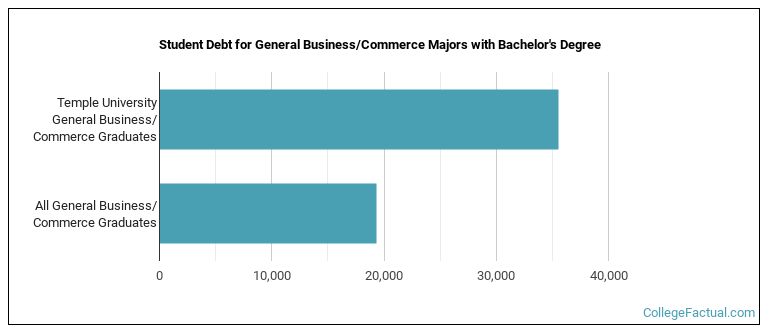
While getting their bachelor's degree at Temple, general business students borrow a median amount of $35,519 in student loans. This is higher than the the typical median of $19,374 for all general business majors across the country.
The typical student loan payment of a bachelor's degree student from the general business program at Temple is $346 per month.
During the 2022-2023 academic year, part-time undergraduate students at Temple paid an average of $1,388 per credit hour if they came to the school from out-of-state. In-state students paid a discounted rate of $833 per credit hour. The following table shows the average full-time tuition and fees for undergraduates.
| In State | Out of State | |
|---|---|---|
| Tuition | $21,023 | $36,280 |
| Fees | $968 | $968 |
| Books and Supplies | $1,240 | $1,240 |
| On Campus Room and Board | $16,968 | $16,968 |
| On Campus Other Expenses | $4,466 | $4,466 |
Learn more about Temple tuition and fees.
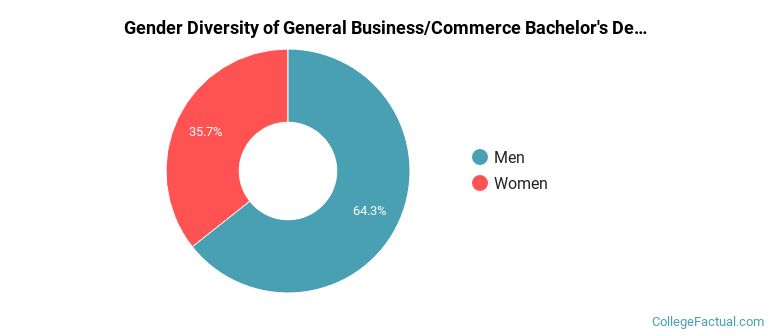
Of the 143 students who graduated with a Bachelor’s in general business from Temple in 2022, 64% were men and 36% were women.
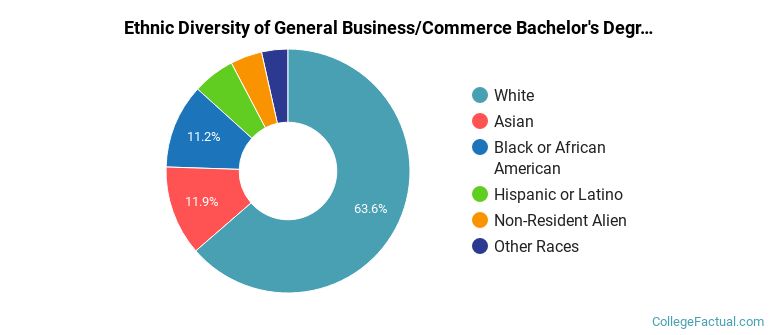
The majority of bachelor's degree recipients in this major at Temple are white. In the most recent graduating class for which data is available, 64% of students fell into this category.
The following table and chart show the ethnic background for students who recently graduated from Temple University with a bachelor's in general business.
| Ethnic Background | Number of Students |
|---|---|
| Asian | 17 |
| Black or African American | 16 |
| Hispanic or Latino | 8 |
| White | 91 |
| Non-Resident Aliens | 6 |
| Other Races | 5 |
Online degrees for the Temple general business bachelor’s degree program are not available at this time. To see if the school offers distance learning options in other areas, visit the Temple Online Learning page.
Take a look at the following statistics related to the make-up of the general business majors at Temple University.
| Related Major | Annual Graduates |
|---|---|
| Business Administration & Management | 351 |
| Finance & Financial Management | 269 |
| Marketing | 228 |
| Accounting | 197 |
| Human Resource Management | 154 |
More about our data sources and methodologies.