
College Factual analyzes over 2,000 colleges and universities in its annual rankings and ranks them in a variety of ways, including most diverse, best overall quality, best for non-traditional students, and much more.
Tyler Junior College was awarded 31 badges in the 2025 rankings. The highest ranked major at the school is dental support services.
Explore the best ranked schools for the programs you are most interested in.
Tyler Junior College landed the #1,306 spot in College Factual's 2025 ranking of best overall colleges in the United States. The higher ed experts analyzed 2,152 colleges and universities across the nation to determine this ranking. This is an improvement over the previous year, when Tyler Junior College held the #1,650 spot on the Best Overall Colleges list.
Out of the 115 colleges in Texas, Tyler Junior College is ranked at #54.
Since Tyler Junior College has an open admissions policy, being accepted to the school isn't that hard. However, a full basic things - such as a high school diploma or equivalent - may be required. Also, go over your application to make sure it is complete before you submit it.
At Tyler Junior College, the student to faculty ratio is 20 to 1. Compared to the national average of 15 to 1, this is somewhat high. This could mean that class sizes may be larger than they are at other colleges or universities or that professors may be required to teach more classes.
Another measure that is often used to estimate how much access students will have to their professors is how many faculty members are full-time. The idea here is that part-time faculty tend to spend less time on campus, so they may not be as available to students as full-timers.
The full-time faculty percentage at Tyler Junior College is 72%. This is higher than the national average of 47%.
During the 2017-2018 academic year, there were 11,749 undergraduates at Tyler Junior College with 5,604 being full-time and 6,145 being part-time.
| $0-30 K | $30K-48K | $48-75 | $75-110K | $110K + |
|---|---|---|---|---|
| $8,681 | $9,555 | $12,193 | $13,957 | $15,005 |
The net price is calculated by adding tuition, room, board and other costs and subtracting financial aid.Note that the net price is typically less than the published for a school. For more information on the sticker price of Tyler Junior College, see our tuition and fees and room and board pages.
It's not uncommon for college students to take out loans to pay for school. In fact, almost 66% of students nationwide depend at least partially on loans. At Tyler Junior College, approximately 27% of students took out student loans averaging $5,011 a year. That adds up to $20,044 over four years for those students.
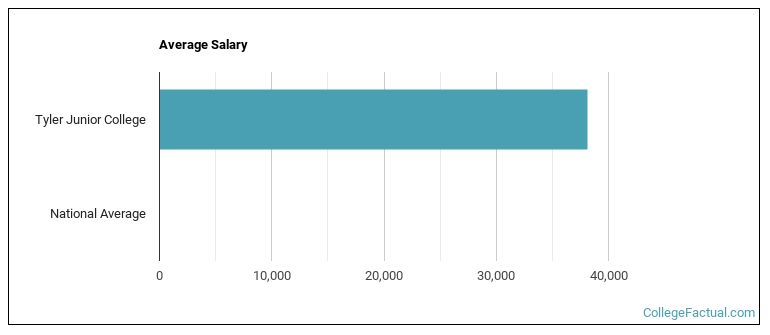
See which majors at Tyler Junior College make the most money.
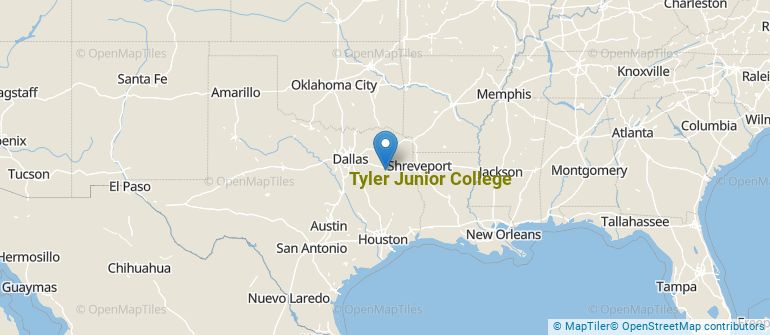
Get more details about the location of Tyler Junior College.
Contact details for Tyler Junior College are given below.
| Contact Details | |
|---|---|
| Address: | 1400 East Fifth Street, Tyler, TX 75701 |
| Phone: | 903-510-2200 |
| Website: | www.tjc.edu/ |
| Most Popular Majors | Bachelor’s Degrees | Average Salary of Graduates |
|---|---|---|
| Liberal Arts General Studies | 591 | NA |
| Business Administration & Management | 221 | NA |
| Nursing | 171 | NA |
| Allied Health Professions | 114 | NA |
| Criminal Justice & Corrections | 112 | NA |
| Practical Nursing & Nursing Assistants | 106 | NA |
| Heating, Air Conditioning, Ventilation & Refrigeration | 90 | NA |
| Vehicle Maintenance & Repair | 72 | NA |
| Health & Medical Administrative Services | 71 | NA |
| Dental Support Services | 70 | NA |
Online learning is becoming popular at even the oldest colleges and universities in the United States. Not only are online classes great for returning adults with busy schedules, they are also frequented by a growing number of traditional students.
In 2022-2023, 6,791 students took at least one online class at Tyler Junior College. This is a decrease from the 6,930 students who took online classes the previous year.
| Year | Took at Least One Online Class | Took All Classes Online |
|---|---|---|
| 2022-2023 | 6,791 | 1,883 |
| 2021-2022 | 6,930 | 2,851 |
| 2020-2021 | 7,462 | 3,002 |
| 2018-2019 | 7,618 | 1,329 |
Footnotes
*The racial-ethnic minorities count is calculated by taking the total number of students and subtracting white students, international students, and students whose race/ethnicity was unknown. This number is then divided by the total number of students at the school to obtain the racial-ethnic minorities percentage.
References
More about our data sources and methodologies.