We've pulled together some essential information you should know about the program, including how many students graduate each year, the ethnic diversity of these students, and more. In addition, we cover how UC Irvine ranks in comparison to other schools with physiology programs.
Go directly to any of the following sections:
The bachelor's program at UC Irvine was ranked #42 on College Factual's Best Schools for physiology list. It is also ranked #5 in California.
| Ranking Type | Rank |
|---|---|
| Best Physiology & Pathology Sciences Bachelor’s Degree Schools | 26 |
| Best Physiology & Pathology Sciences Schools | 42 |
During the 2021-2022 academic year, University of California - Irvine handed out 17 bachelor's degrees in physiology & pathology sciences. This is an increase of 70% over the previous year when 10 degrees were handed out.
The average full-time tuition and fees for undergraduates are shown in the table below.
| In State | Out of State | |
|---|---|---|
| Tuition | $11,834 | $42,611 |
| Fees | $2,403 | $2,403 |
| Books and Supplies | $1,550 | $1,550 |
| On Campus Room and Board | $18,423 | $18,423 |
| On Campus Other Expenses | $4,841 | $4,841 |
Learn more about UC Irvine tuition and fees.
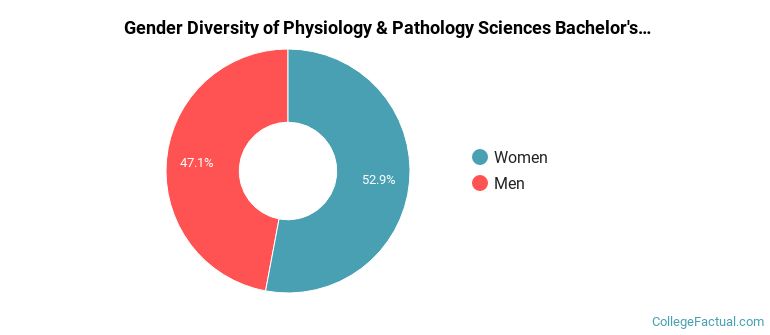
The physiology program at UC Irvine awarded 17 bachelor's degrees in 2021-2022. About 47% of these degrees went to men with the other 53% going to women.
The following table and chart show the ethnic background for students who recently graduated from University of California - Irvine with a bachelor's in physiology.
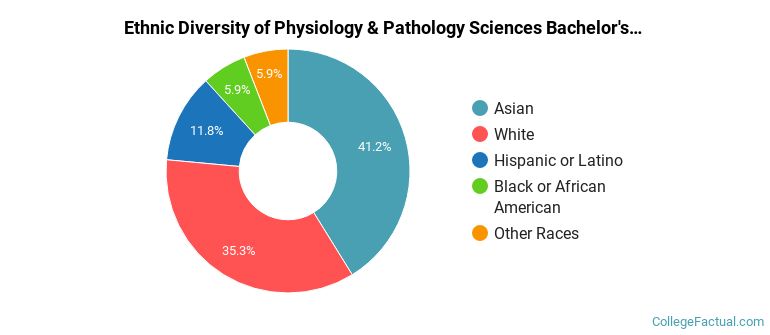
| Ethnic Background | Number of Students |
|---|---|
| Asian | 7 |
| Black or African American | 1 |
| Hispanic or Latino | 2 |
| White | 6 |
| Non-Resident Aliens | 0 |
| Other Races | 1 |
UC Irvine does not offer an online option for its physiology bachelor’s degree program at this time. To see if the school offers distance learning options in other areas, visit the UC Irvine Online Learning page.
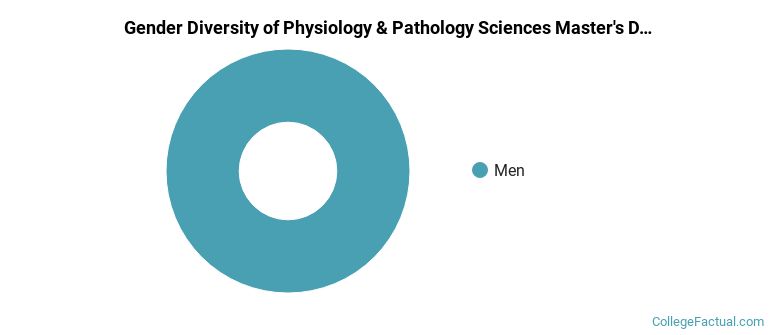
All of the 1 students who graduated with a Master’s in physiology from UC Irvine in 2022 were men.
The following table and chart show the ethnic background for students who recently graduated from University of California - Irvine with a master's in physiology.

| Ethnic Background | Number of Students |
|---|---|
| Asian | 0 |
| Black or African American | 0 |
| Hispanic or Latino | 0 |
| White | 0 |
| Non-Resident Aliens | 0 |
| Other Races | 1 |
Take a look at the following statistics related to the make-up of the physiology majors at University of California - Irvine.
| Related Major | Annual Graduates |
|---|---|
| General Biology | 668 |
| Neurobiology & Neurosciences | 96 |
| Biochemistry, Biophysics & Molecular Biology | 56 |
| Ecology, Evolution & Systematics Biology | 34 |
| Microbiological Sciences & Immunology | 26 |
More about our data sources and methodologies.