College Factual recognizes the best colleges and universities in its annual rankings. These rankings include categories for best overall colleges, best colleges for each major, best value schools, and much more.
University of Indianapolis was awarded 7 badges in the 2025 rankings. The highest ranked major at the school is general psychology.
Explore the best ranked schools for the programs you are most interested in.
According to College Factual's 2025 analysis, UIndy is ranked #796 out of 2,152 schools in the nation that were analyzed for overall quality.
Out of the 41 colleges in Indiana, UIndy is ranked at #15.
University of Indianapolis has an acceptance rate of 76%, which makes it somewhat selective. Make sure it's not the only school you apply to, even if it's your school of choice. Whether you get in or not will largely depend on how you compare to other applicants.
The student to faculty ratio is often used to measure the number of teaching resources that a college or university offers its students. The national average for this metric is 15 to 1, but at UIndy it is much better at 11 to 1. That's good news for students who want to interact more on a personal level with their teachers.
In addition to the student to faculty ratio, some people look at what percentage of faculty members are full-time as a sign of how much time professors will be able to spend with their students. This is because part-time teachers may not be be on campus as much as their full-time counterparts.
The full-time faculty percentage at University of Indianapolis is 100%. This is higher than the national average of 47%.
The freshmen retention rate is a sign of how many full-time students like a college or university well enough to come back for their sophomore year. At University of Indianapolis this rate is 61%, which is a bit lower than the national average of 68%.
The on-time graduation rate for someone pursuing a bachelor's degree is typically four years. This rate at UIndy for first-time, full-time students is 51%, which is better than the national average of 33.3%.
Find out more about the retention and graduation rates at University of Indianapolis.
During the 2017-2018 academic year, there were 4,271 undergraduates at UIndy with 3,863 being full-time and 408 being part-time.
| $0-30 K | $30K-48K | $48-75 | $75-110K | $110K + |
|---|---|---|---|---|
| $16,953 | $16,549 | $22,208 | $26,310 | $25,518 |
The net price is calculated by adding tuition, room, board and other costs and subtracting financial aid.Note that the net price is typically less than the published for a school. For more information on the sticker price of UIndy, see our tuition and fees and room and board pages.
Almost 66% of college students who graduated with the class of 2018 took out student loans, but that percentage varies from school to school. At UIndy, approximately 64% of students took out student loans averaging $6,532 a year. That adds up to $26,128 over four years for those students.
Get more details about paying for University of Indianapolis.
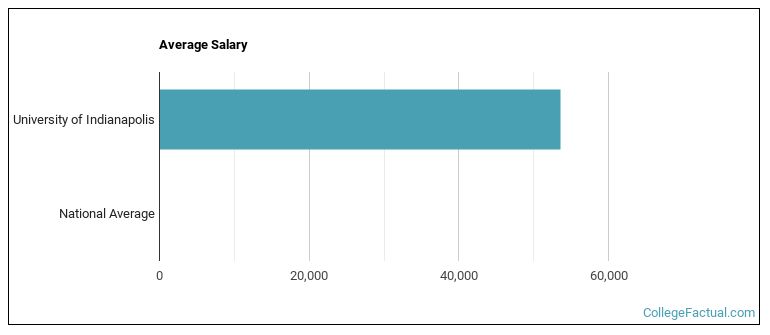
See which majors at University of Indianapolis make the most money.
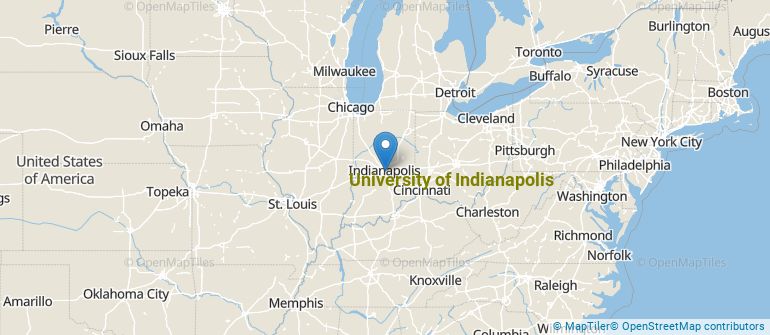
Get more details about the location of University of Indianapolis.
Contact details for UIndy are given below.
| Contact Details | |
|---|---|
| Address: | 1400 E Hanna Ave, Indianapolis, IN 46227-3697 |
| Phone: | 317-788-3368 |
| Website: | https://uindy.edu/ |
| Facebook: | http://www.facebook.com/uindy |
| Twitter: | http://twitter.com/uindy |
| Most Popular Majors | Bachelor’s Degrees | Average Salary of Graduates |
|---|---|---|
| Public Health | 443 | NA |
| Nursing | 173 | $71,248 |
| Business Administration & Management | 168 | $44,216 |
| Health & Physical Education | 138 | $38,364 |
| Rehabilitation & Therapeutic Professions | 132 | NA |
| General Psychology | 99 | $32,237 |
| Finance & Financial Management | 66 | $54,590 |
| Clinical, Counseling & Applied Psychology | 50 | NA |
| Teacher Education Grade Specific | 47 | $45,250 |
| Writing Studies | 47 | NA |
Online learning options are becoming more and more popular at American colleges and universities. Online classes are great for students who have busy schedules or for those who just want to study on their own time.
In 2022-2023, 2,161 students took at least one online class at University of Indianapolis. This is a decrease from the 2,445 students who took online classes the previous year.
| Year | Took at Least One Online Class | Took All Classes Online |
|---|---|---|
| 2022-2023 | 2,161 | 620 |
| 2021-2022 | 2,445 | 408 |
| 2020-2021 | 5,304 | 1,335 |
| 2018-2019 | 1,255 | 317 |
Learn more about online learning at University of Indianapolis.
If you’re considering University of Indianapolis, here are some more schools you may be interested in knowing more about.
Curious on how these schools stack up against UIndy? Pit them head to head with College Combat, our free interactive tool that lets you compare college on the features that matter most to you!
Footnotes
*The racial-ethnic minorities count is calculated by taking the total number of students and subtracting white students, international students, and students whose race/ethnicity was unknown. This number is then divided by the total number of students at the school to obtain the racial-ethnic minorities percentage.
References
More about our data sources and methodologies.